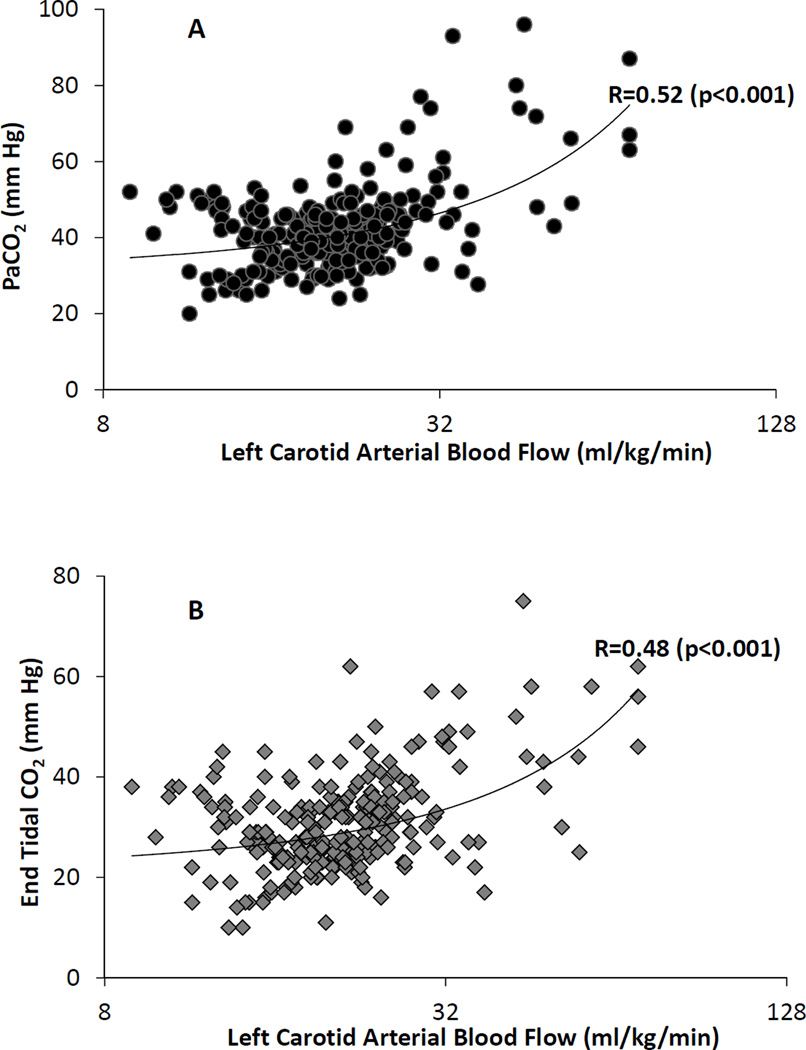
Figure 3.
(A) Scatter plot of left carotid arterial blood flow and PaCO2 showed a moderate correlation (R-0.52, rho-0.31, p<0.001). (B) Scatter plot of left carotid arterial blood flow and ETCO2 showed a moderate correlation (r-0.48, rho-0.48, p<0.001). The left carotid arterial blood flow is plotted on a logarithmic scale.

