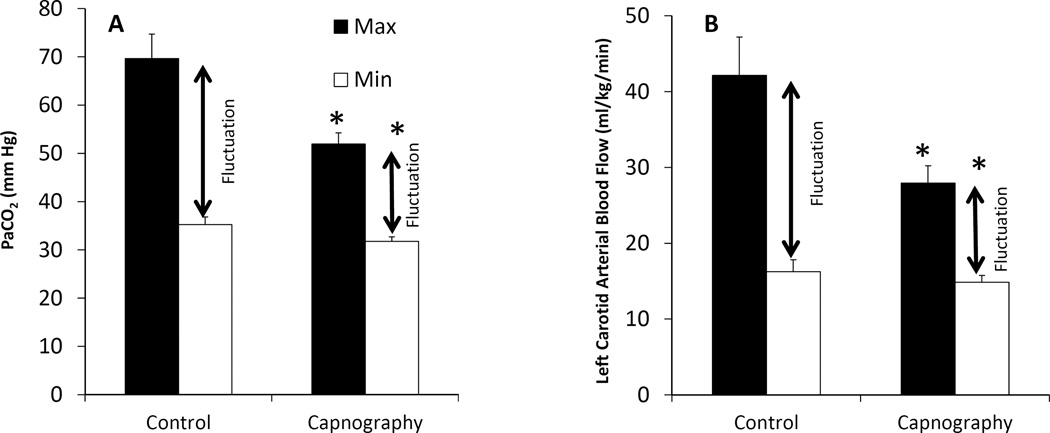
Figure 5.
(A) The fluctuations in PaCO2 (mmHg) is depicted as a bar diagram in the capnography group and control group. The amplitude of fluctuations (difference between the mean maximum and minimum values) were significantly different (p=0.002). (B) The fluctuations in left carotid arterial blood flow (ml/kg/min) are depicted as bar diagrams between the groups. The fluctuations (difference between the mean maximum and minimum values) were significantly different (p=0.008).

