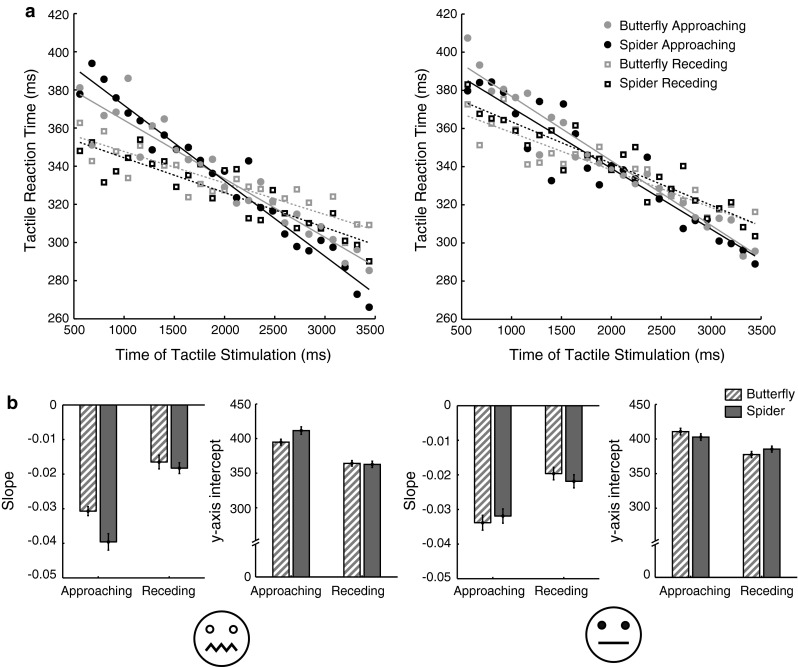
Fig. 3.

Average median reaction times and fitted linear functions. The average median reaction times to approaching and receding spiders and butterflies at all 25 time points for high- (left) and low-fear (right) participants, as well as their fitted linear functions (a) and average slope and intercept parameters for the fitted linear functions (b). Please note that for approaching animations, earlier time points correspond to the stimulus being further way. The error bars represent the within-subject standard deviation
