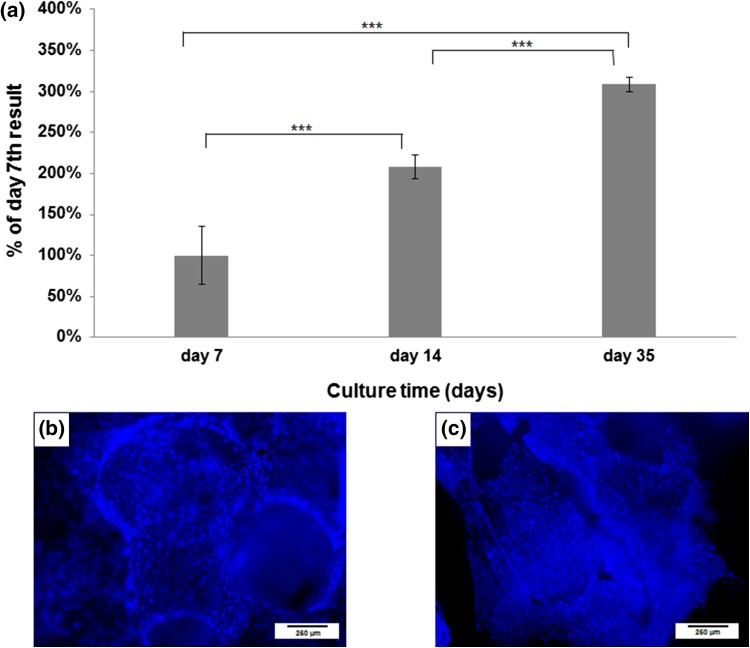
Figure 3.
The results of the XTT test carried out on day 7, 14 and 35 of a dynamic HBDCs culture in the bioreactor (A)—the number of cells was significantly higher in each successive time point. The results are presented as a % of day 7th result, which was considered as 100%. Mean values ± standard deviation (SD) are shown (n = 6). Asterisks show significant differences (***p < 0.001) (Mann–Whitney test). Uniform cell distribution on the 3D calcite scaffold on day 7th (B—external surface of the scaffold) and on day 35th (C—interior of the scaffold) of dynamic culture. Cells were visualized after staining their nuclei with Hoechst.

