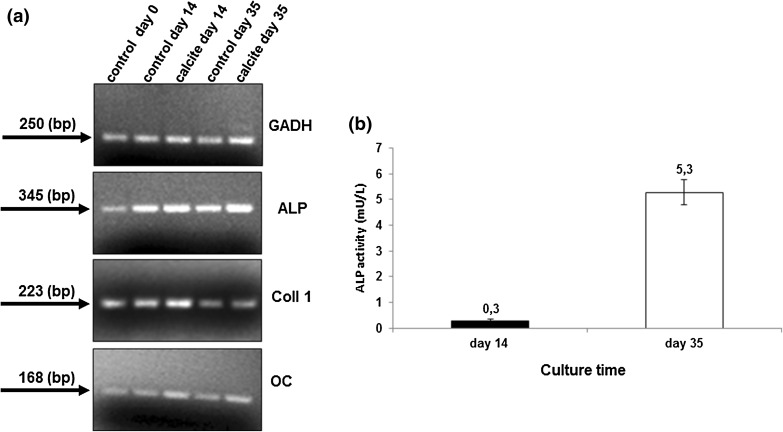
Figure 4.
Representative samples of agarose gel electrophoresis profiles of RT-PCR products—GAPDH, ALP, COLL 1, OC specific genes primers were used. Analysis was performed on the selected time points in HBDCs cultured on the control surface and in the 3D calcite scaffolds. All products exhibited appropriate sizes visualized on ethidium bromide stained gels (a). ALP activity measured in cells cultured on 3D calcite scaffolds for 14 and 35 days. ALP activity has been shown in relation to a single cell in culture (b). Mean values ± standard deviation (SD) are shown (n = 6). The differences between the groups were statistically significant (p < 0.001) (Mann–Whitney test).

