Figure 4.
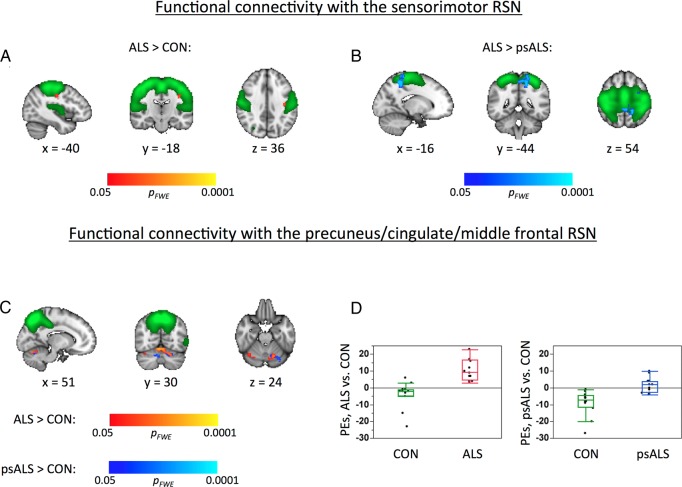
Functional connectivity. Within the sensorimotor RSN, there was increased FC in (A) the ALS patient group compared to controls, and (B) in the ALS patient group compared to the psALS group. (C) FC within the P-C-MF RSN was increased in both the ALS patient and psALS groups compared to controls. Results (shown in red-yellow and blue colours) are overlaid onto the respective RSNs (thresholded at z>3, green) and the T1-weighted MNI template (greyscale). x/y/z=MNI coordinates. Using significance masks for areas of increased FC in the P-C-MF RSN between patients with ALS and controls, (D) illustrates differences in FC within this RSN for patients with ALS compared to controls (left panel) and psALS participants compared to controls (right panel). ALS, amyotrophic lateral sclerosis; FC, functional connectivity; P-C-MF, precuneus-cingulate-middle frontal; RSN, resting state network.

