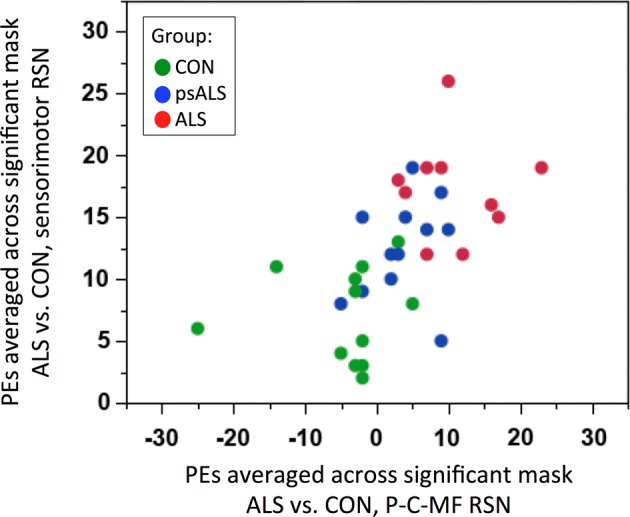
Figure 5.

Functional connectivity discrimination. Distribution of PE extracted from sensorimotor (y axis) and the P-C-MF (x axis) RSNs, areas that show significantly increased FC between patients with ALS and healthy controls, across the three groups. ALS, amyotrophic lateral sclerosis; FC, functional connectivity; P-C-MF, precuneus-cingulate-middle frontal; PEs, parameter estimates; RSN, resting state network.
