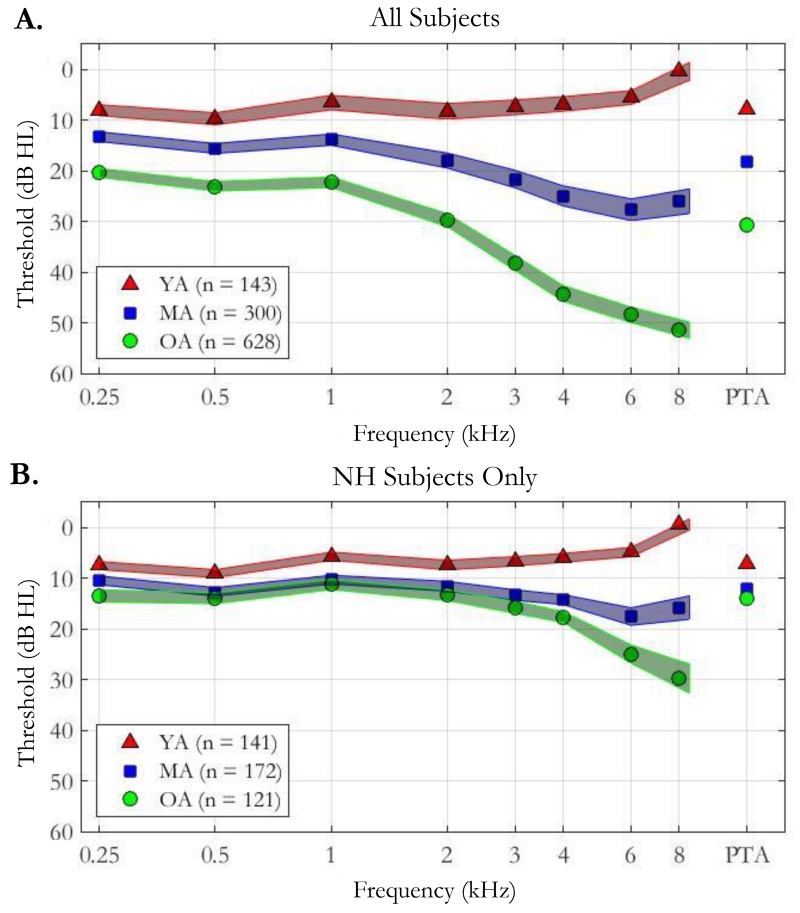
Figure 1.
Pure tone thresholds (dB HL) at octave frequencies for all subjects (top panel) and the normal-hearing (NH) subset (bottom panel) separated by age group: younger adults (YA; red triangles) between the ages of 18 and 40, middle-aged adults (MA; blue squares) between the ages of 40 and 65, and older adults (OA; green circles) greater than 65 years. Pure tone average (PTA), measured as the average pure tone threshold at 500, 1000, and 2000 Hz, is shown for each age group on the righthand side of each panel. Shaded regions depict 95% confidence regions. The NH group was determined by omitting listeners from the full dataset who had poorer than 25 dB HL at any octave frequencies up to 4000 Hz.

