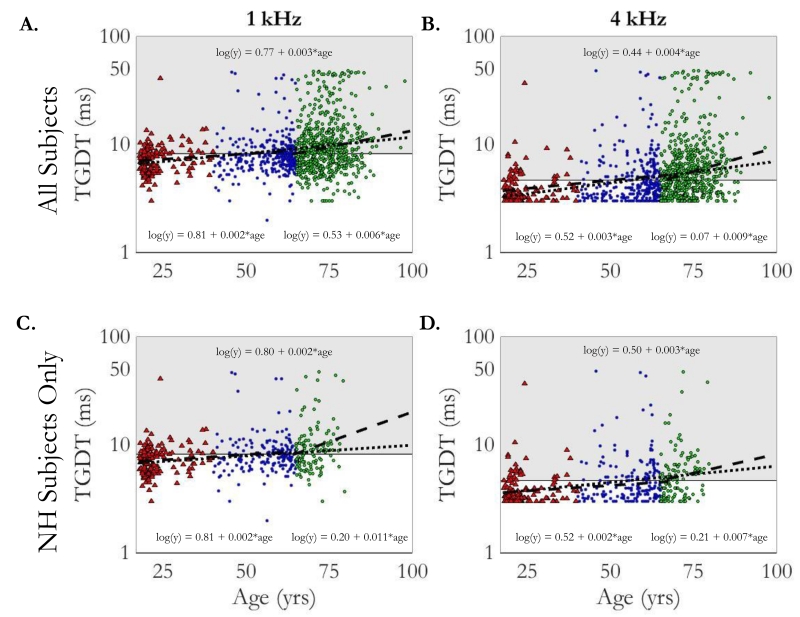
Figure 2.
Individual temporal gap detection thresholds (TGDTs) are shown as function of age for all subjects in the top row (panels A and B) and for the normal-hearing subset in the bottom row (panels C and D). The left column shows data for the 1 kHz low-pass-filtered noise (panels A and C) and the right column shows data for the 4 kHz low-pass-filtered noise (panels B and D). Colors and markers indicate age group (YA, MA, OA) consistent with those in Figure 1. Grey regions represent thresholds falling above the 95% confidence interval of the YA group thresholds. Change-point linear regression fits (dashed line) and equations (below the fits) are provided for each dataset. A single linear fit (dotted line) and equation (above the fit) is also provided for comparison..

