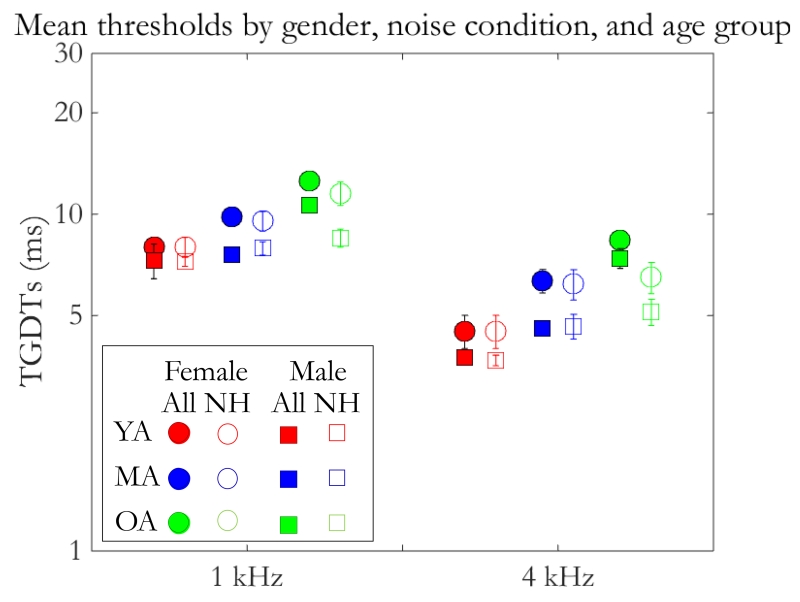
Figure 4.
Average (mean) thresholds are plotted with respect to gender (Female: circles; Male: squares), noise condition (abscissa), and age group (YA: red; MA: blue; OA: green). Unfilled markers aside each filled marker represent mean thresholds in the normal-hearing subset from the neighboring condition in the full dataset, respectively. Error bars show ±1 standard error of the mean (SEM).

