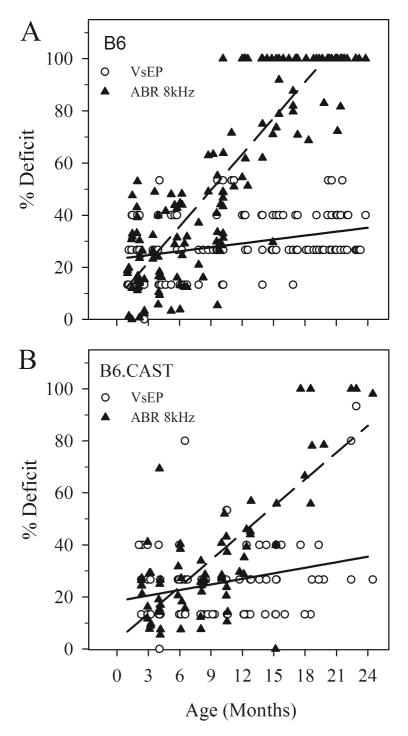
Figure 5.
Normalized thresholds showing percentage deficit of VsEP and 8 kHz ABR dynamic ranges as a function of age. % deficit reflects the loss in sensory dynamic range due to elevated thresholds. 100% indicates complete loss in dynamic range i.e. no response at any stimulus level. Combined male and female data for both strains are represented. A. B6: Percent deficit for VsEP thresholds (open circles) increased slightly with age. The average rate of decline is indicated by the regression line shown (solid): y = 0.50x + 23.2 %. In contrast, ABR percent deficit increased at a steep rate for B6 (dashed line): y = 4.61x + 8.0 %. B. B6.CAST: Percent deficit increased slightly with age similar to B6 at an average rate shown by the regression line shown (solid): y = 0.71 + 18.4 %. Percent deficit for ABR in B6.CAST increased at a significantly higher rate than VsEP but at a significantly lower rate than B6 ABR. Regression line (dashed): y = 3.44 + 3.3 %.

