
Figure 5.
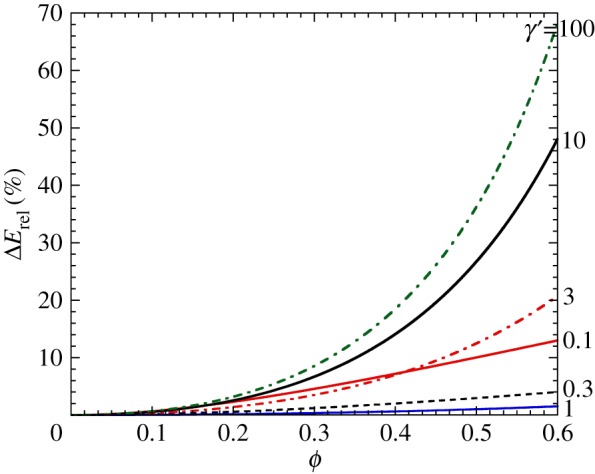
In the incompressible matrix case, the per cent deviation between the dilute and EIAS theories ΔErel versus ϕ, shown for the same valuesof γ′ as in figure 4: 0.1 (red, solid line), 0.3 (black, dashed line), 1 (blue, solid line), 3 (red, dashed-dotted line), 10 (black, solid line) and 100 (green, dashed-dotted line). (Online version in colour.)