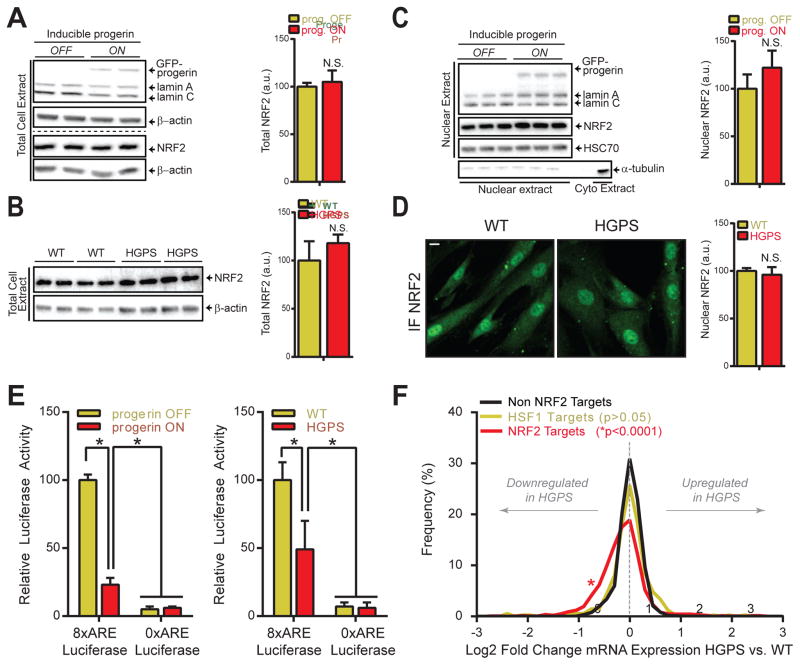
Fig 2. NRF2 transcriptional activity is impaired in HGPS.
(A) Western blot (WB) analysis of total progerin inducible fibroblasts (P1 cells, See Experimental Procedures) extracts (2 biological replicates). Dotted line indicates separate WBs. (B) WB of total cell extract of WT and HGPS fibroblast (2 biological replicates for 4 cell lines, see Experimental Procedures). (C) WB of nuclear P1 cell extract (3 biological replicates of P1 cells). α-tubulin serves as cytoplasmic control. (D) NRF2 IF staining (Abcam 62352) in formaldehyde fixed WT and HGPS fibroblasts. N>300; Scale bar: 10μm. (E) ARE-luc assay (See Experimental procedures). *p<0.05. (F) Line graph of Log2 mRNA expression changes between WT and HGPS fibroblasts for indicated transcriptional targets. A left-shift of the NRF2-targets plot indicates an increased frequency of NRF2 regulated target genes that are downregulated in HGPS patients (p<0.0001).

