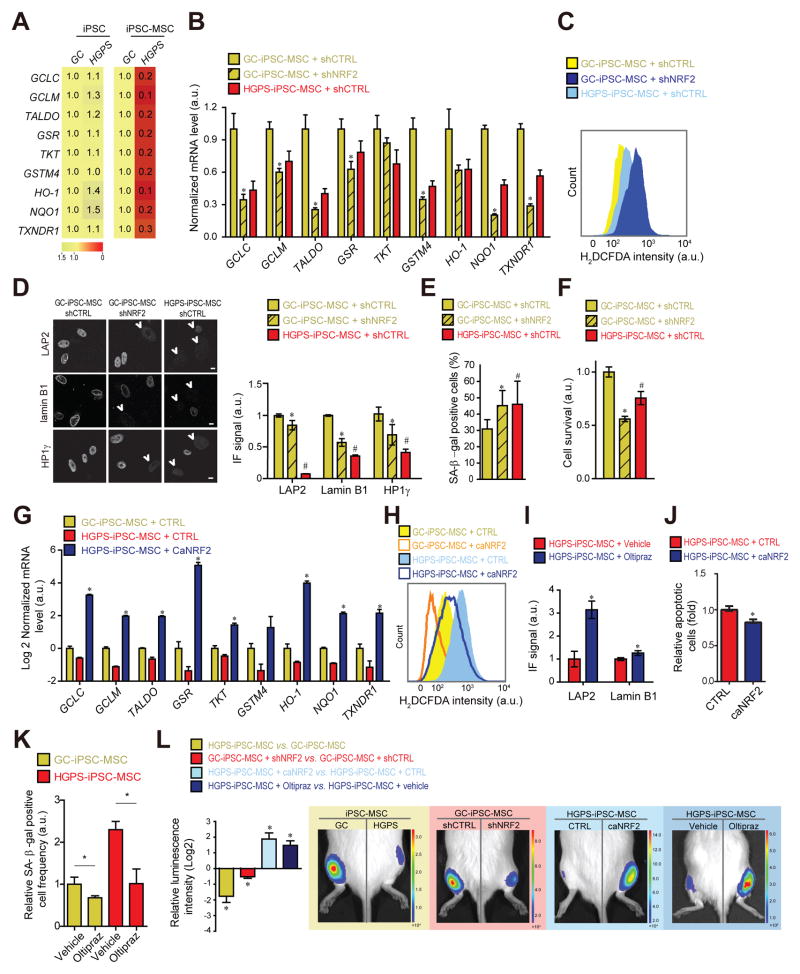
Fig 6. NRF2 activation alleviates HGPS mesenchymal stem cell viability defects.
(A) Heatmap of NRF2-target mRNA expression levels. Values represent averages from at least 3 experiments. (B) NRF2 target mRNA expression. *p<0.05, GC/shCTRL vs. GC/shNRF2. (C) H2DCFDA-based ROS quantification. (D) IF analysis of lamin B1 (manual count of low lamin expressing B1 cells), LAP2 and HP1γ (See experimental Procedures). Scale bar: 10 μm. N>300. P<0.05: *GC/shCRTL vs. GC/shNRF2; #GC/shCRTL vs. HGPS/shCTRL. (E) Frequency of SA-β-gal positive cells and (F) relative cell survival rate (See Experimental Procedures). p<0.05: *GC/shCRTL vs. GC/shNRF2; #GC/shCTRL vs. HGPS/shCTRL. (G) NRF2-target mRNA expression levels. *p<0.05, HGPS/CTRL vs. HGPS/caNRF2. (H) H2DCFDA-based ROS quantification for indicated cell types. (I) IF quantification (See panel D) in vehicle or Oltipraz treated (20 μM; 3 weeks) HGPS-iPSC-MSCs. N>100. *p<0.05. (J) Relative amounts of apoptotic cells and (K) SA-β-galactosidase positive cells in GC- and HGPS-iPSC-MSC expressing caNRF2 or treated with Oltipraz (20 μM; 3 weeks). N>300. *p<0.05. (L) In vivo MSC implantation assay for indicated conditions (Oltipraz: 20 μM; 3 wks) (N=3–5). *p<0.05 for indicated comparisons: HGPS vs. GC; GC/shNRF2 vs. GC/shCTRL; HGPS/caNRF2 vs. HGPS/CTRL; HGPS/Oltipraz vs. HGPS/Vehicle. For all bar-graphs values represent averages ± SD from at least 3 experiments.

