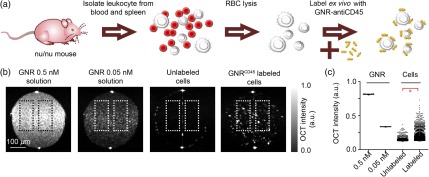
Fig. 1.
Leukocyte labeling with . (a) Schematic of leukocyte labeling with . (b) From left to right OCT images of 0.5 nM GNR solution, 0.05 nM GNR solution, unlabeled leukocytes, and -labeled leukocytes. All samples were loaded into internal diameter glass capillaries for OCT imaging and imaged together. . (c) Mean of log of OCT intensities from contiguous regions of size 10 pixels or larger within the dotted boxes shown in (b). Data pooled over 150 B-scans from three independent experiments. * value (unpaired -test).

