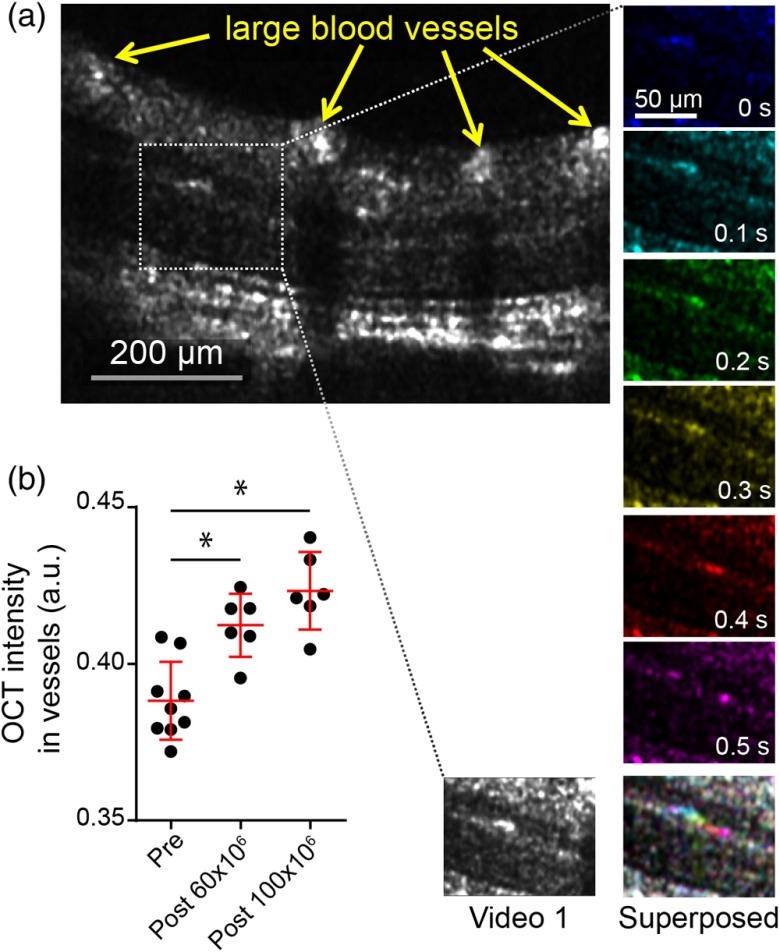
Fig. 5.
-labeled leukocytes in retinae of nu/nu mice. (a) OCT image of a nu/nu mouse retina postinjection of -labeled leukocytes (left, large blood vessels indicated by yellow arrows), and six sequential images of the boxed area inside the OCT image (each average of three B-scans) color-coded by time. Elapsed time is indicated inside each frame, with the first frame (blue) assigned time point 0. Superposition of the six frames (right) shows a multicolored path, indicative of a moving cell within a capillary. (left) and (right). (also refer to Video 1, MOV, 5.91 MB) [URL: http://dx.doi.org/10.1117/1.JBO.21.6.066002.1]. (b) OCT intensity in blood vessels shown in (a), with each data point representing intensity inside a single blood vessel summed over 100 B-scans before injection (pre) and after injection of and total -labeled leukocytes. Red line and bars indicate . * value (unpaired -test).

