
Fig. 2.
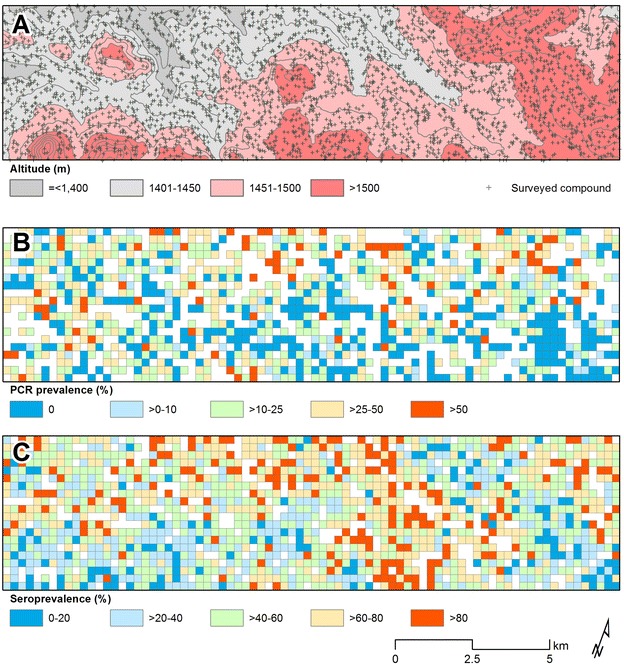
Maps representing altitude, spatial variation of nPCR and antibody prevalence in the study area Western Kenyan highlands Rachuonyo South District, Nyanza Province. A Detailed overview of the altitude in the study area. B Average nPCR prevalence in 250 × 250 m zones. C Average combined seroprevalence (for AMA-1 or MSP-119) in 250 × 250 m zones