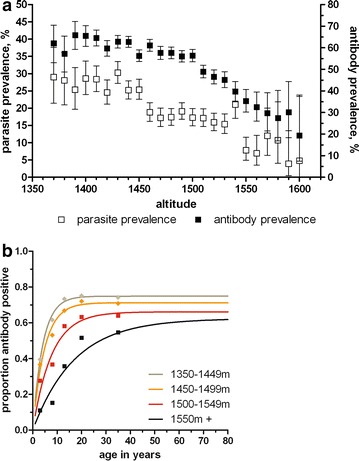
Fig. 3.

Parasite prevalence and antibody responses in relation to altitude. a Presents parasite prevalence by PCR (open squares) and malaria-specific antibody prevalence (MSP-119 and/or AMA-1 antibodies detected by ELISA) showed a strong negative association with altitude (r = 0.92, p < 0.0001 for both associations). b Presents the age-dependent antibody acquisition at different altitudes. Lines show the fitted association between age and antibody positivity for individuals residing at 1350–1449 m (grey line, n = 4967), 1450–1499 m (orange line, n = 6252), 1500–1549 m (red line, n = 4361) and 1550 meters and above (black line, n = 777). Symbols indicate parasite prevalence estimates for children below 5 years of age, 6–10 years, 11–15 years, 16–25 years and >26 years. Symbols are plotted at the median age for the different categories; for the highest age category parasite prevalence is plotted at 35 years
