
Fig. 4.
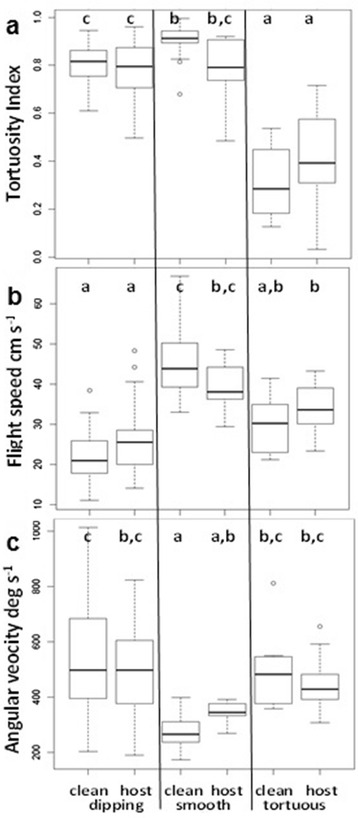
Comparison of flight types in clean air and in host odour. Solid lines represent median values, empty circles represent outliers. Bottom and top of the box show the 25th and 75th percentile, respectively. Whiskers show maximum and minimum values or 1.5 times interquartile range, whichever is the smaller. a Tortuosity index. b Flight speed. c Angular velocity. Different letters indicate boxes that are significantly different (Tukey P < 0.001, Two-way ANOVA). Numbers of tracks in clean air; dipping (41), smooth (20) and tortuous (8) and in host odour; dipping (25), smooth (7) and tortuous (17)