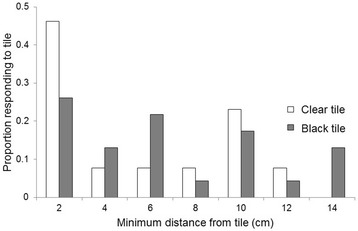
Fig. 7.

Distribution of minimum distances at which mosquitoes turned away from object in host odour. The distribution of responses to the clear object is significantly different from an equal distribution (Chi-squared goodness of fit test, n = 13, df = 6, χ 2 = 13.38, P < 0.05), whereas the distribution of responses to the black object is not (n = 23, df = 6, χ 2 = 6.52, P = 0.36)
