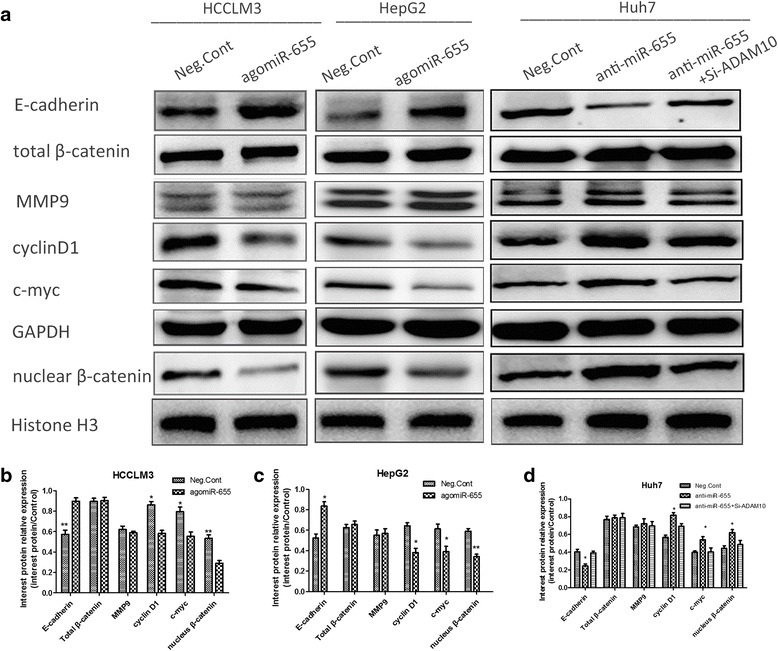
Fig. 4.

MiR-655-3p up-regulated E-cadherin expression and inhibited β-catenin signal pathway in HCC cells. a Western blot analysis of E-cadherin and β-catenin signal pathway proteins after transfection of miR-655-3p agomiR or antagomiR or controls. b, c, d Column charts were used to display the changes of protein expression. Gray value was analyzed by Image J Software. Histone H3 was used an internal control for nuclear β-catenin, and GAPDH for others. Data are mean ± SEM (n = 3). *p < 0.05, **p < 0.01, and ***p < 0.001 compared to controls
