
Fig. 5.
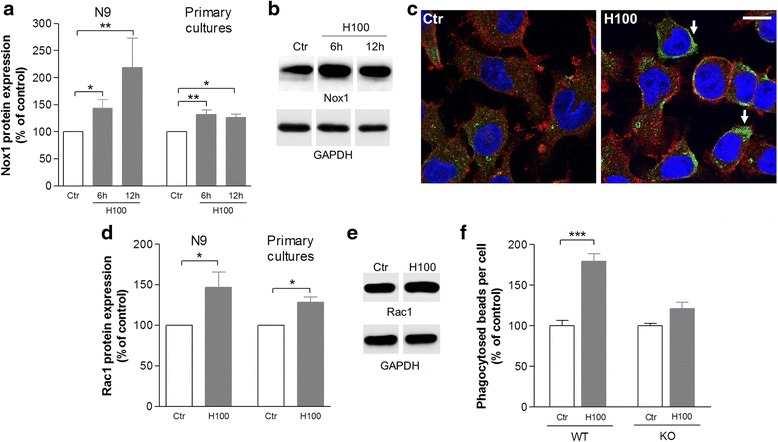
Rac-1/Nox1 signaling is involved in microglial phagocytosis triggered by histamine. a Bar graph depicting Nox1 protein expression levels upon treatment with 100 μM histamine (H100) for 6 or 12 h, both in the N9 cell line and primary microglial cell cultures. Data are expressed as mean ± SEM (n = 4–10) and as a percentage of control. *P < 0.05 and **P < 0.01, using Bonferroni’s multiple comparison test as compared with control. b Representative Nox1 (65 kDa) and GAPDH (37 kDa) Western blots in primary microglial cell cultures. c Representative confocal photomicrographs showing that 100 μM histamine-induced Nox1 expression in the luminal side of the plasma membrane of N9 microglial cells (highlighted by white arrows). Cells were stained for CD11b (red), Nox1 (green), and Hoechst 33342 (nuclei in blue). Scale bar 10 μm. d Bar graph depicting Rac1 protein expression levels upon treatment with 100 μM histamine (H100) for 1 h, both in the N9 cell line and primary microglial cell cultures. Data are expressed as mean ± SEM (n = 3–8) and as a percentage of control. *P < 0.05 using paired t test as compared with control. e Representative Rac1 (22 kDa) and GAPDH (37 kDa) Western blots in primary microglial cell cultures. f Bar graph displays the effect of histamine on the phagocytosis of IgG latex beads in Nox1 knockout mice (KO) and their respective wild-type (WT) littermates. Data are expressed as mean ± SEM (n = 4) and as a percentage of control. ***P < 0.001 using Bonferroni’s multiple comparison test as compared with control