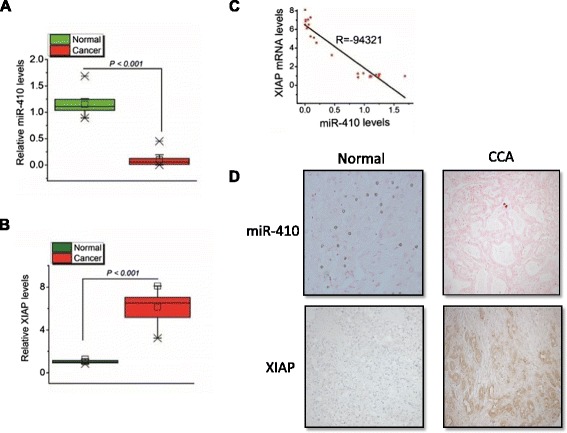
Fig. 4.

Inverse correlation between miR-410 and XIAP levels in cholangiocarcinoma tissues and controls. a-b Expression levels of miR-410 and XIAP in normal (n = 12) and cholangiocarcinoma (cancer, n = 22) patient tissues. Results are presented as boxes with whiskers (minimum to maximum), relative to normal. c Correlation of miR-410 to XIAP mRNA levels. R corresponds to correlation coefficient. d In situ hybridization for miR-410 (black) and immunostaining for XIAP (brown stain) in normal and CCA tissues
