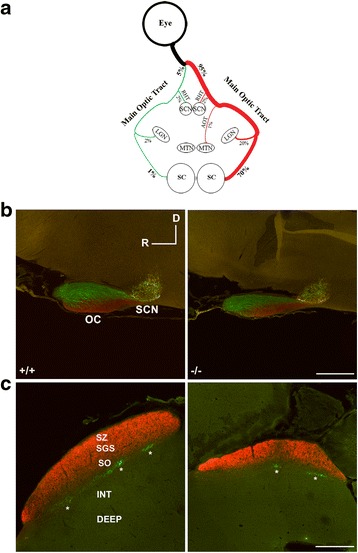
Fig. 8.

RGC projections to the optic chiasm (OC), suprachiasmatic nucleus (SCN) and superior colliculus (SC). a Diagram depicting the three major optic tracts [main optic tract, accessory optic tract (OAT) and retino-hypothalamic tract (RHT)] in brain and associated visual centers (nuclei) [SCN, lateral geniculate nuclei (LGN), medial terminal nucleus (MTN) and SC. b, c Sagittal brain sections from AP-2δ+/+ and AP-2δ−/− mice intravitreally injected with CTB. Red, projections from the contralateral eye to the OC and SCN (b) and SC (c); green, projections from the ipsilateral eye to the OC and SCN (b) and SC (c). D, dorsal; R, rostral; SZ, stratum zonale; SGS, stratum griseum superficiale; SO, stratum opticum. Asterisks indicate clusters of ipsilateral projections. Scale bars = 200 μm (b) and 500 μm (c). Photographs were taken with a Zeiss LSM710 confocal microscope equipped with 10× lens
