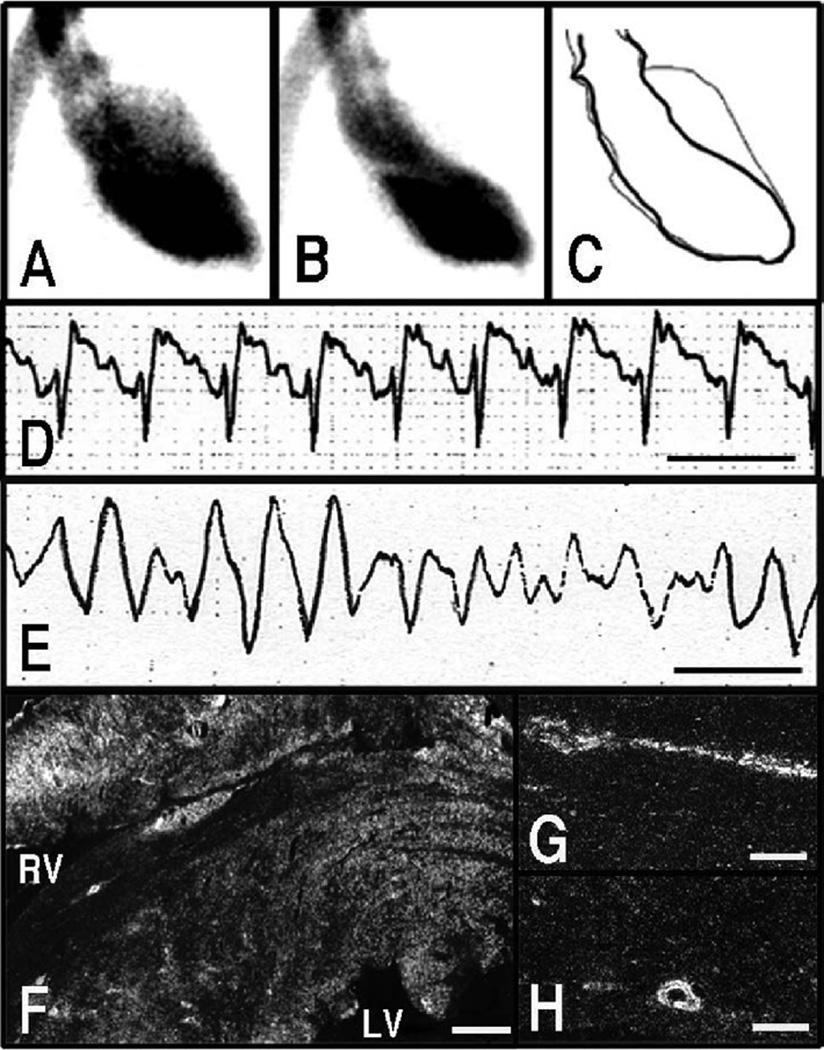
Figure 3.
Left ventriculographic (A through C) and ECG (D and E) changes in response to immobilization of rats. Left ventriculogram, right anterior oblique (30°) projection. A, Diastole. B, systole. C, The trace of A and B. Reduced left ventricular contraction around the left ventricular apex was observed in response to stress. ECG, lead II. Line indicates 0.2 second. ST-segment elevation (D) was observed in response to stress. A case of ventricular fibrillation also was observed (E). Dark-field photomicrograph showing signals for c-jun mRNA in the heart (F) and coronary arteries (G and H) sampled at 30 minutes from the onset of immobilization. Strong signals were observed in myocardium surrounding the left and right ventricular cavities (F). These signals also were observed in endothelial cells and smooth muscle cells of coronary arteries (G and H). Bar=600 µm (F) and 100 µm (G and H). A through C, Adapted and modified from Ueyama et al,51 with permission from the Japanese Circulation Society.

