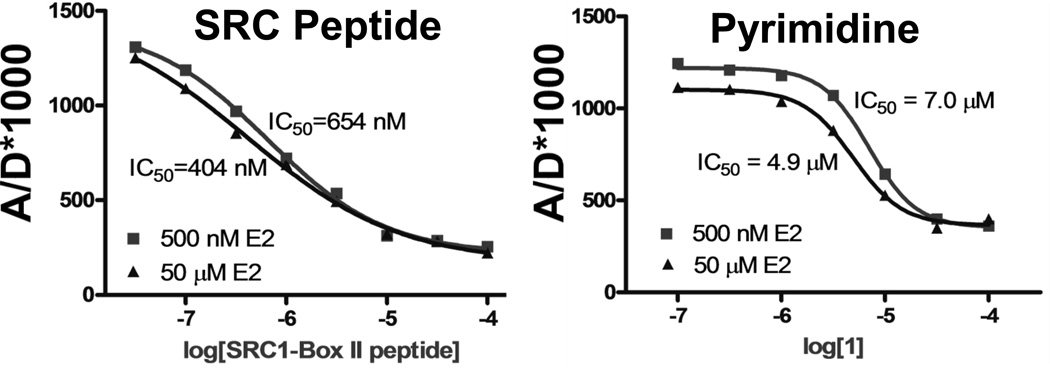
Figure 2.
Representative data from a fluorescence resonance energy transfer (FRET) assay. By plotting the ratio of the emission intensities of the acceptor to the donor (A/D*1000) against the log of ligand molar concentration, dose-response curves for displacement of SRC-3-NRD-fluorescein by the steroid receptor coactivator peptide (left) and pyrimidine coactivator binding inhibitor 1 (right) can be generated. Varying the concentration of the agonist 17β-estradiol (E2; 500 nM (■) and 50 µM (▲)) has no substantial effect on the IC50 values of the compounds, implying that these positive control compounds do not compete with E2 for the ligand-binding pocket but act by direct displacement of the SRC-3-NRD-fluorescein.

