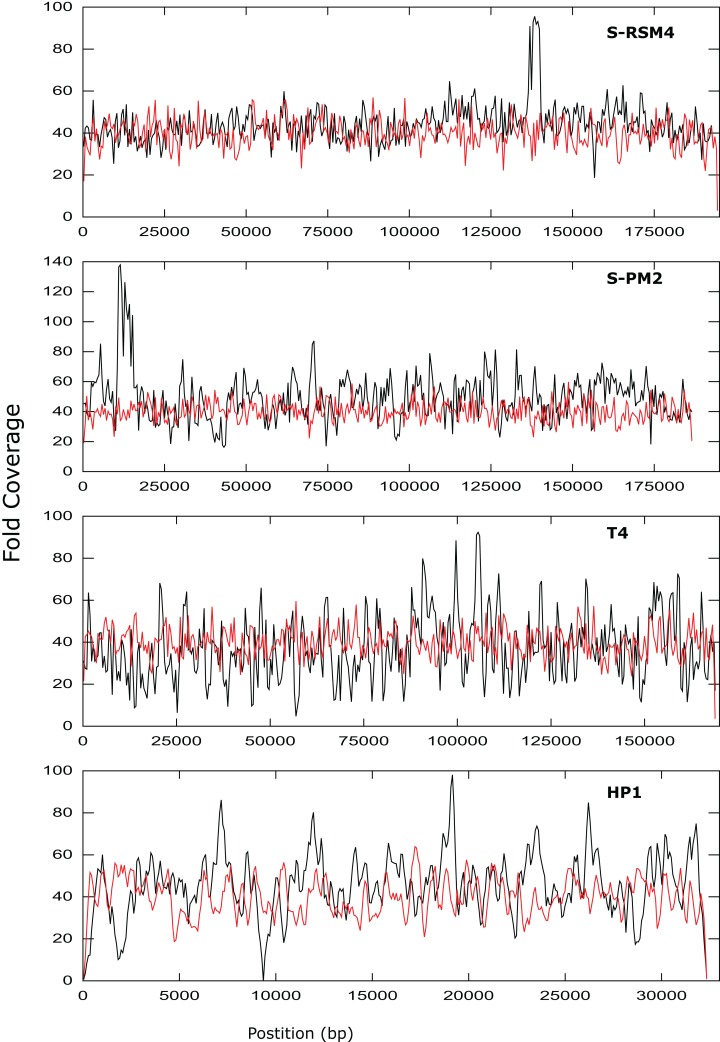
Figure 3. Coverage across the genomes of S-PM2, S-RSM4, T4 and HP1.
Reads were mapped against the reference genomes of S-PM2d (accession: LN828717), S-RSM4 (accession: NC_013085.1), T4 (accession: AF_158101) and HP1 (accession: NC_001697.1). The data is representative of an average 40× coverage. Red lines are in silico reads, black lines are sequence reads.

