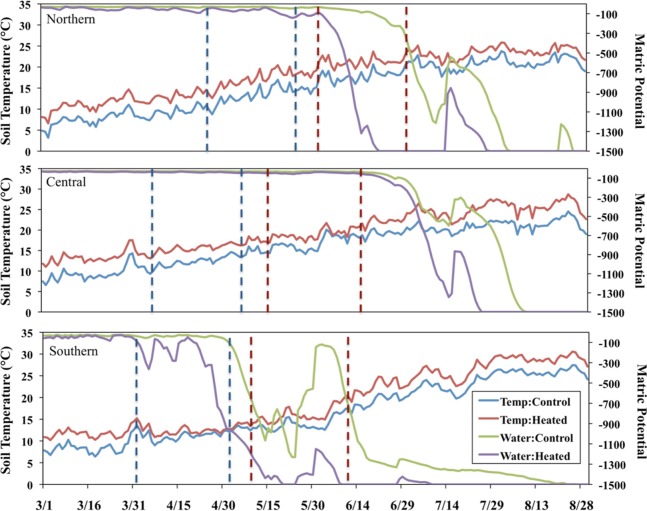
Figure 1. Soil temperature and water availability in the 2011 growing season.
Panels correspond with sites, dotted lines indicate the time period used to estimate soil temperature and matric potential one month prior to plant collection. Because of the different phenology, red lines refer to perennial species and blue lines refer to the annual species.

