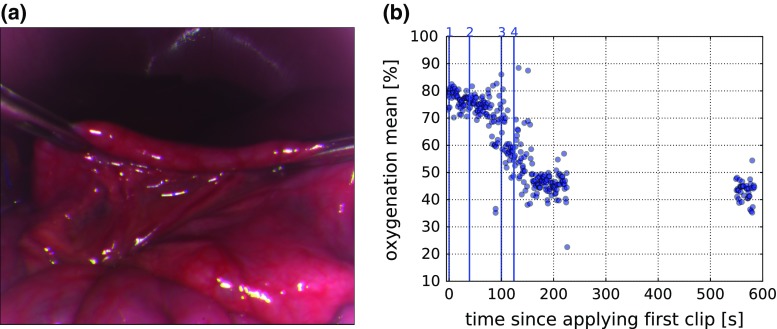
Fig. 5.
Qualitative validation of the proposed method in a porcine small bowel (a). The plot (b) shows the mean oxygenation in the small bowel segment as a function of time. The vertical lines show the time points at which the three vessels were clipped. The first two clips were applied to the same vessel. The high variations before setting the third clip and after setting the forth clip are caused by fast camera movements. After setting the last clip, the camera was removed and reinserted about 10 min after setting the first clip

