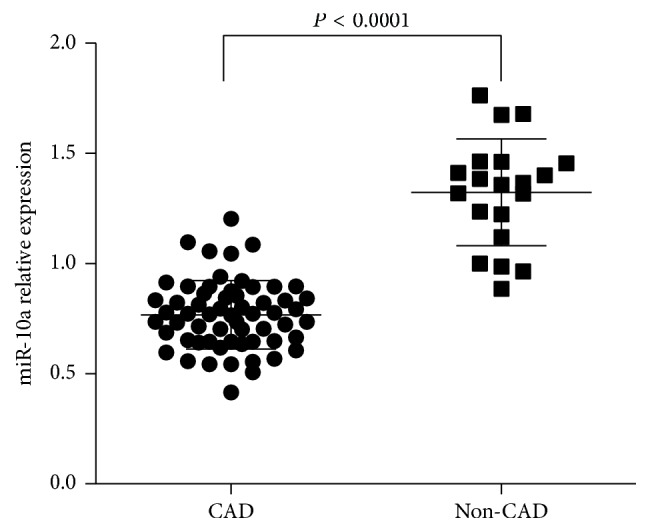
Figure 1.

Plasma miR-10a levels in CAD patients and non-CAD controls. Plasma miR-10a levels were detected in CAD patients compared with non-CAD controls by qRT-PCR. The expression levels of miR-10a were normalized to RNU6B. P values were calculated using Student's t-test.
