Figure 4.

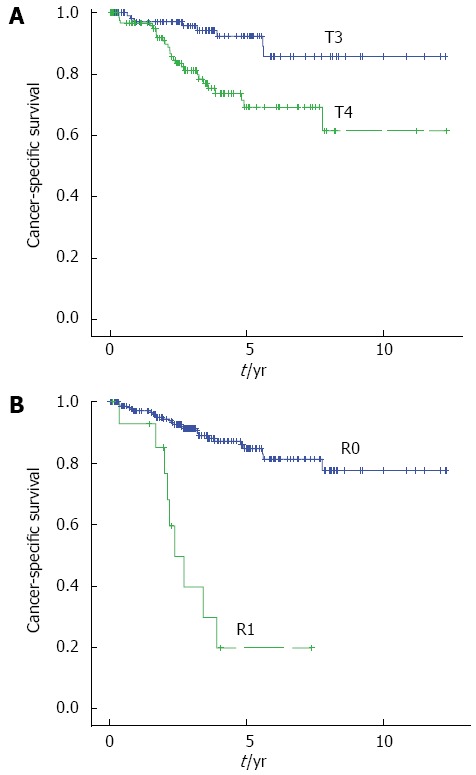
Kaplan-Meier curves showing the cancer-specific survival rates in patients with T4 tumor and R1 resection. A: T3 (n = 108, blue line); T4 (n = 126, green line); B: R0 (n = 219, blue line), R1 (n = 15, green line).

Kaplan-Meier curves showing the cancer-specific survival rates in patients with T4 tumor and R1 resection. A: T3 (n = 108, blue line); T4 (n = 126, green line); B: R0 (n = 219, blue line), R1 (n = 15, green line).