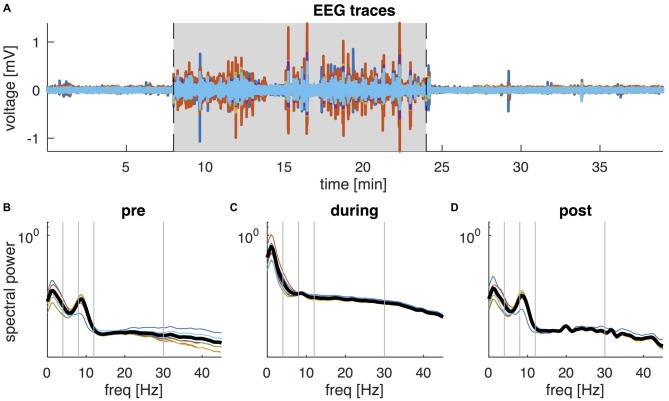
Figure 2.
EEG data of a representative participant. (A) Butterfly plot of the six EEG channels (F7, F4, Cz, P3, P4, Oz) during the 38-min recording. Shaded area shows the interval of active tDCS. (B–D) Shows the corresponding power spectral density (PSD) of the six EEG channels during the interval before tDCS (B), during tDCS (C), and following tDCS (D). Thick black lines show the average PSD across channels. Vertical lines separate the frequencies into the conventional frequency bands: delta (0–4 Hz), theta (4–8 Hz), alpha (8–12 Hz), beta (13–30 Hz) and lower gamma (30–45 Hz).

