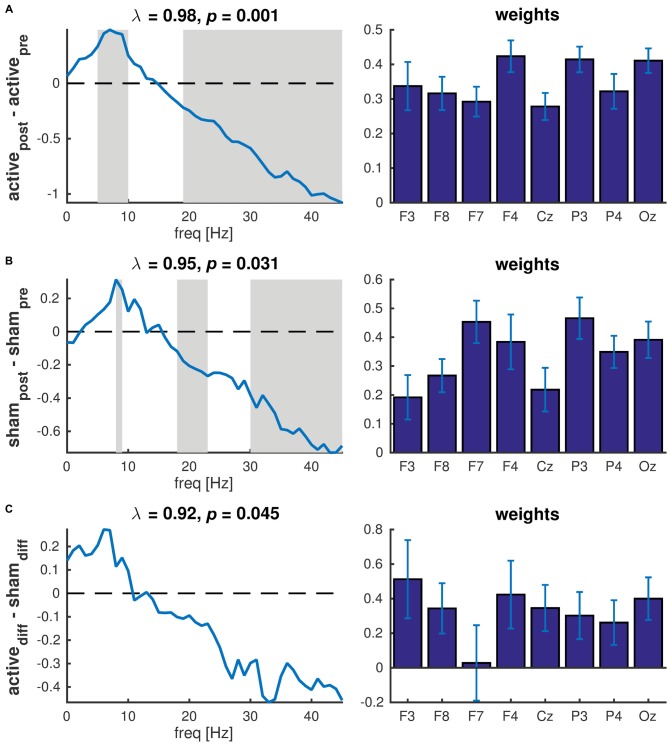
Figure 5.
Partial least squares (PLS) of PSD across all EEG channels. (A) Contrast between pre and post active tDCS; (B) Contrast between pre and post sham; (C) Contrast between difference in active tDCS and sham. Left panels show the latent variables (frequency spectra) of each significant component revealing the changes in spectral power between conditions. The gray patches show the frequencies at which the difference was statistically significant as determined used bootstrapping. λ indicates the explained variance and p the p-value determined using permutation testing. Right panels show the corresponding weights reflecting the contribution of each EEG channel to the significant component. Error bars reflect the standard deviation estimated using bootstrapping.

