Figure 6.

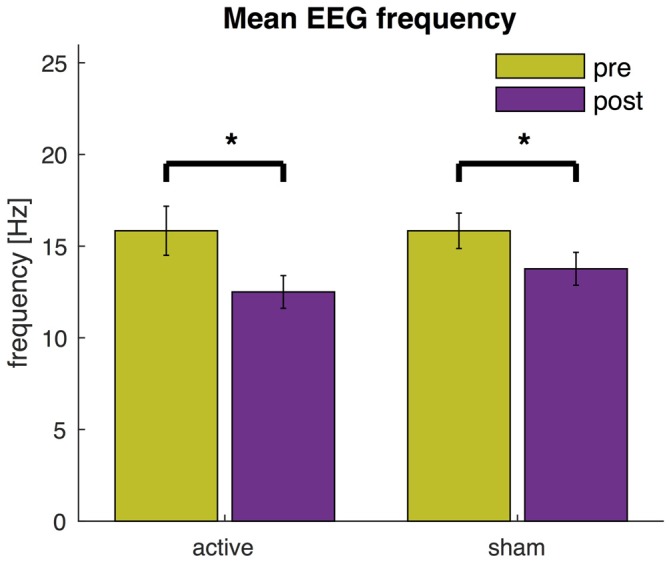
EEG mean frequency before and after active tDCS and sham. The mean frequency is averaged across all EEG channels. Error bars indicate the standard error and asterisks changes that are statistically significant (P < 0.05).

EEG mean frequency before and after active tDCS and sham. The mean frequency is averaged across all EEG channels. Error bars indicate the standard error and asterisks changes that are statistically significant (P < 0.05).