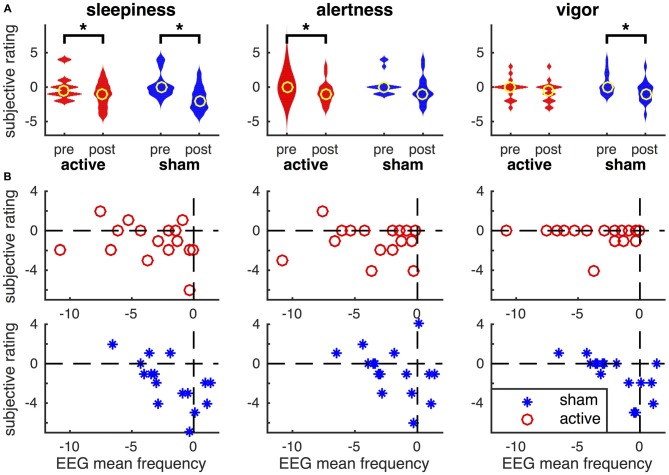
Figure 8.
Relationship between subjective ratings of their physiological state and the EEG mean frequency. (A) Violin plot of subjective ratings of sleepiness, alertness and vigor before and after active tDCS and sham. Note, that polarity of sleepiness is reversed such that a higher rating means one is less sleepy. Yellow circles depict the median across participants and asterisks changes that are statistically significant (P < 0.05). (B) Relationship between changes in EEG mean frequency (on x-axis) and changes in subjective ratings of participant’s physiological state (y-axis). Changes are computed as post minus pre. Data for each participant are shown as red circles in active tDCS and blue asterisks for sham tDCS.

