
Table 2.
Schematic representation of ADMET and TOPKAT properties of ComAI and its derivatives.
| Name | Structure | Docking score/interaction site | Toxicity prediction(ADMET and TOPKAT) | ||||
|---|---|---|---|---|---|---|---|
| Rule of 3 and rule of 5 | QPlogHERG | QPlogBB | QPlogKhsa | Human oral absorption (%) | |||
| ComAI | 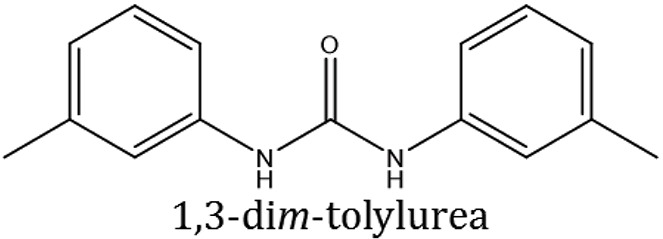 |
−3.088 Q11 |
 |
|
|
|
100 |
| Derivatives of ComAI | |||||||
| ComAI1 | 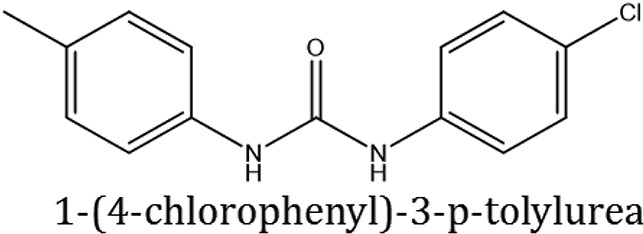 |
−3.815 Q11 |
|
|
|
|
100 |
| ComAI2 |  |
−3.334 Q11,Q95 |
|
|
|
|
100 |
| ComAI3 |  |
−3.214 Q11, Q47, L94 |
|
|
|
|
86.7 |
| ComAI4 |  |
−3.342 Q11,Q95 |
|
|
|
|
100 |
| ComAI' |  |
−0.485 – |
|
|
|
|
– |
Toxicity free behavior.