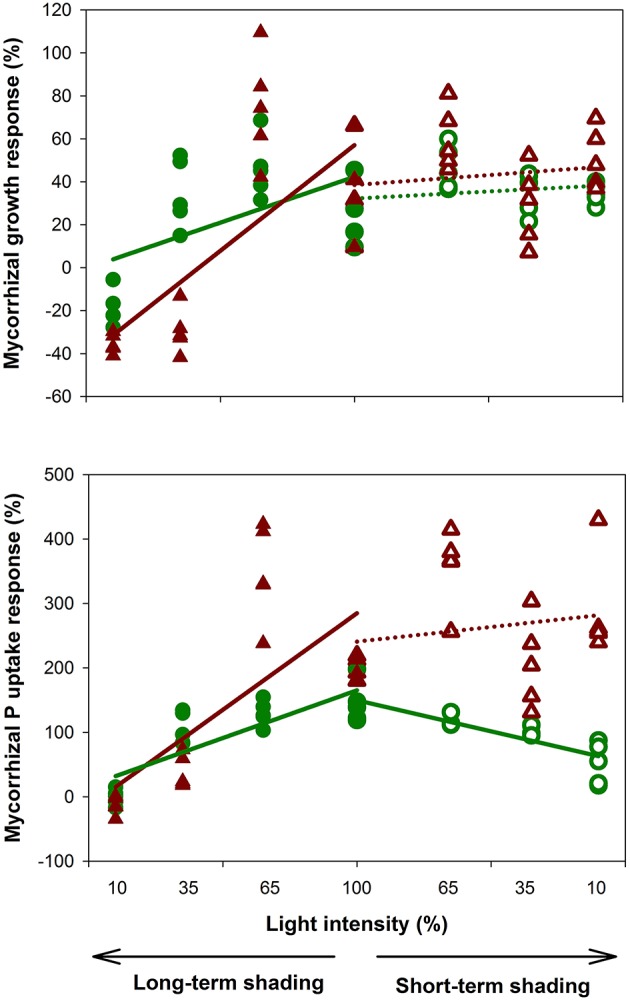
Figure 1.

Growth and phosphorus uptake responses of Medicago truncatula plants subjected to experimental shading—either long-term (38 days, closed symbols) or short term (6 days, open symbols) shading, with four different light intensities each. Five replicate values for shoots (green circles) and roots (brown triangles) per light treatment are shown, together with the linear regression lines testing consistency of the observed effects along the shading gradients (separately for the short- and long-term shading and for the roots and shoots). Mycorrhizal responses were calculated as 100 × (AM-NM)/NM, where AM is the shoot or root dry weight of mycorrhizal plant and NM is the mean value of the respective non-mycorrhizal control treatment (N = 5). Solid lines indicate significant trends (p < 0.05), whereas dotted lines show lack of statistical significance along the shading gradient.
