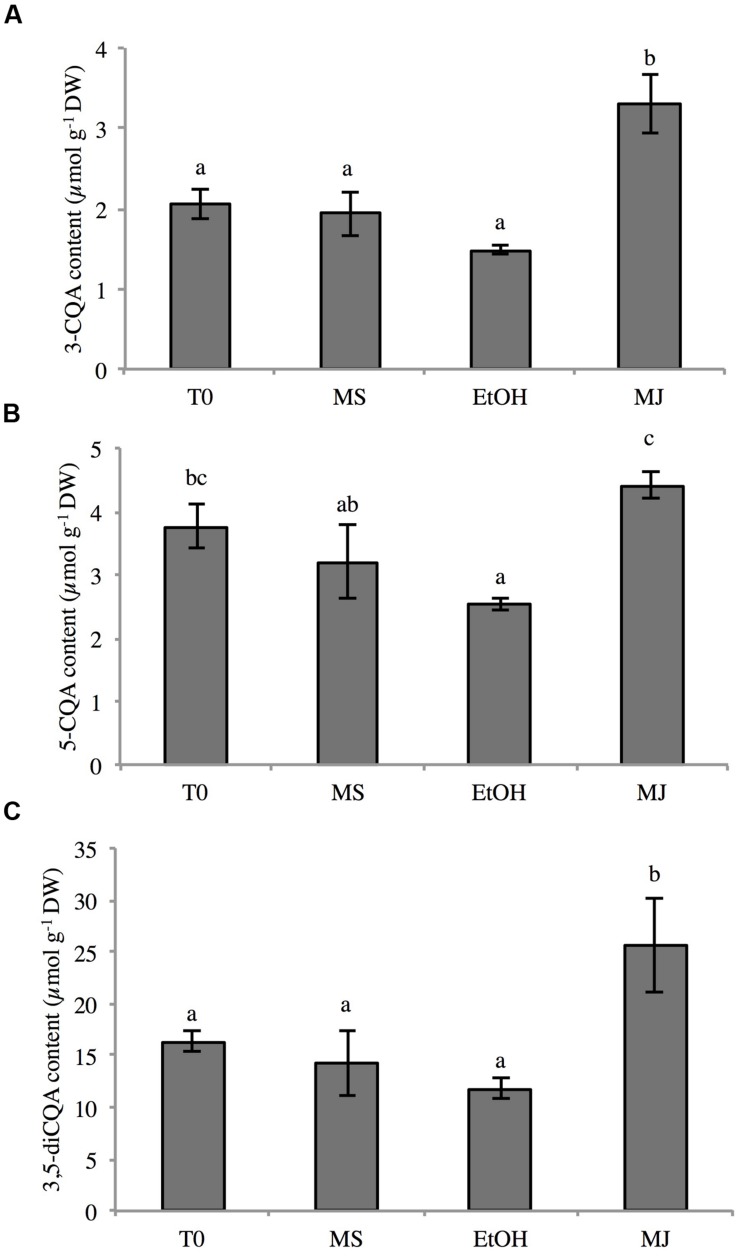
FIGURE 4.
Contents of 3-CQA (A), 5-CQA (B), and 3,5-diCQA (C) in chicory cell cultures under different conditions. Methanolic extracts were analyzed by HPLC. T0: cell culture sampled before elicitation, MS: cultures kept on MS medium for 24 h, EtOH: cell cultures treated with ethanol for 24 h, MJ: cell cultures treated with 50 μM MeJA for 24 h. Values are means of three replicates ± SD. Different letters in the same histogram indicate significant differences detected using ANOVA (P < 0.05).

