
Figure 1.
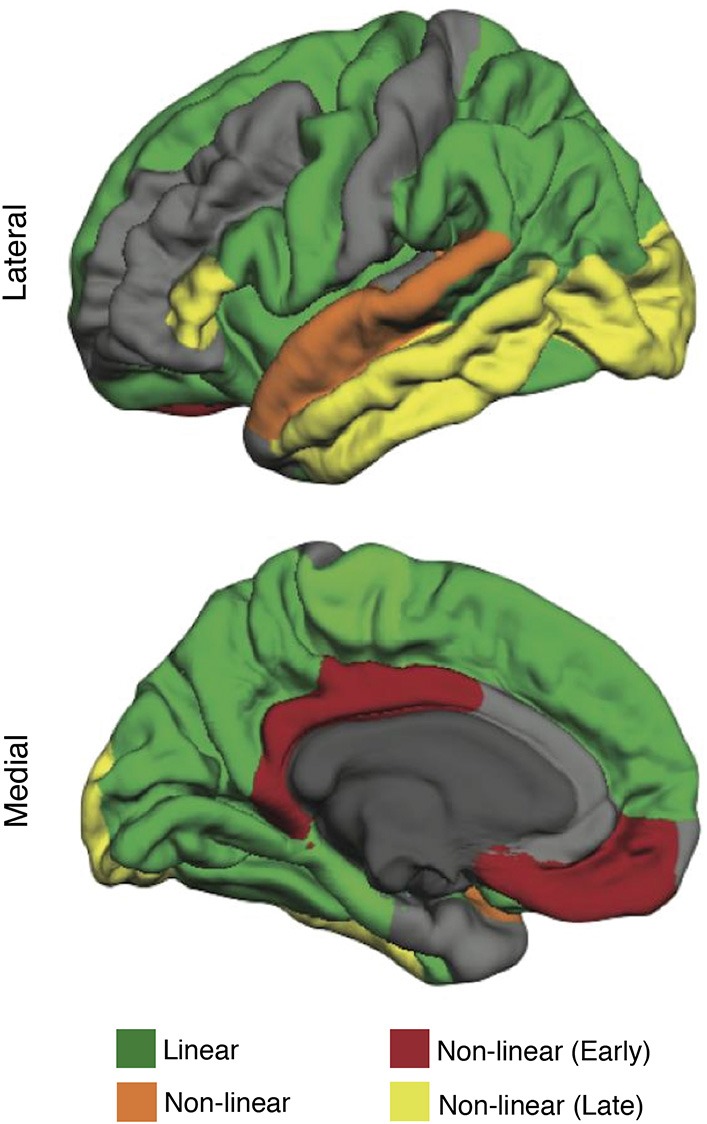
The effect of aging on brain structure (cortical thickness) in healthy older adults (mean age 63.38 ± 12.23 years). Regions highlighted in green follow a linear rate of atrophy. Regions highlighted in orange show decline early in aging, stabilize, and then decline again late in aging. Regions highlighted in red show decline early in aging (decrease quickly early in aging but stabilize late in aging). Regions highlighted in yellow show decline late in aging (remain structurally intact early in aging but decrease quickly late in aging). Modified from Claassen et al. (2016) in Aging and Disease licensed under CC BY.