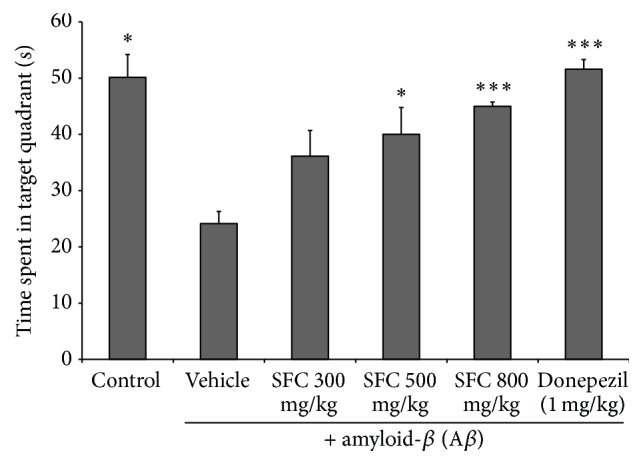
Figure 3.

The mean escape latency of each group in the probe trial. The time spent in the target quadrant during the probe trial is presented. Data represent the mean ± SEM. ∗ p < 0.05 and ∗∗∗ p < 0.001 versus the Aβ-treated group. SFC: steamed and fermented C. lanceolata.
