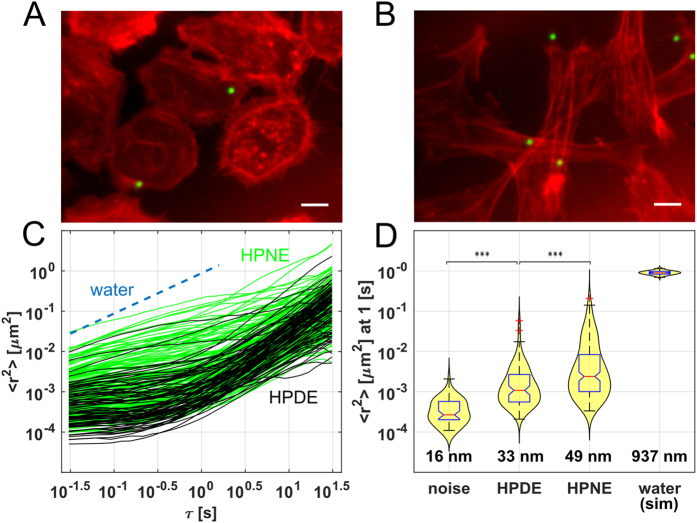
Figure 2. Imaging cells and PBR measurements in the AHTM.
Imaging and example MSD data from HPDE and HPNE cultures. HPDE (A) and HPNE (B) cells imaged with the AHTM in the 490 nm and 575 nm channels and merged in ImageJ. 2 μm YG beads are shown in green and 568 alexafluor phalloidin stained F-actin in red. MSD vs τ curves measured by the AHTM are shown in panel C. HPNE (green) and HPDE (black) curves, selected for the anomalous diffusion model are shown, with a reference line for the calculated diffusion of similar particles in water. At τ = 1 s, the median of all curves are plotted, with summary statistics, in panel D. The expected median MSD and distribution for beads attached to the substrate (noise) and in water (simulation) are also presented as a reference along with RMS displacements in nanometers.

