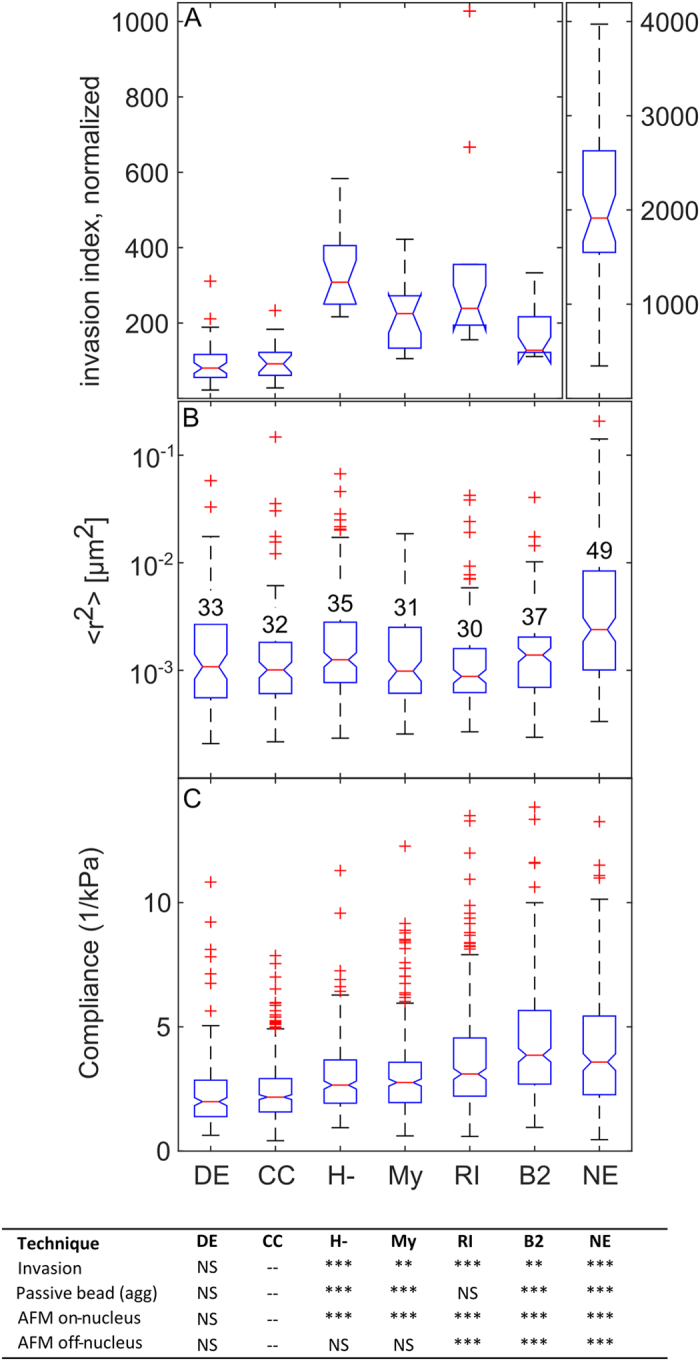
Figure 3. Effect of constructs on Invasion and Cell Compliance.

(A) Notched boxplot showing results of invasion assay, where added constructs correlate with higher invasivity. (B) Median MSD and RMS displacements in nm at τ = 1 s for each construct, as assessed by the AHTM system for Plate 2. Results for the 4 separate 96-well plates used in this study are shown as Supplementary Fig. 5. (C) Median compliance data AFM measurements over cell nucleus. (D) Table of significance values for the four constructs and three comparison cultures shown in (A–C), along with off-nucleus AFM data (Supplementary Fig. 7), where *, **, and *** correspond to Bonferroni-corrected p-values p < 0.05, p < 0.01, and p < 0.001 respectively.
