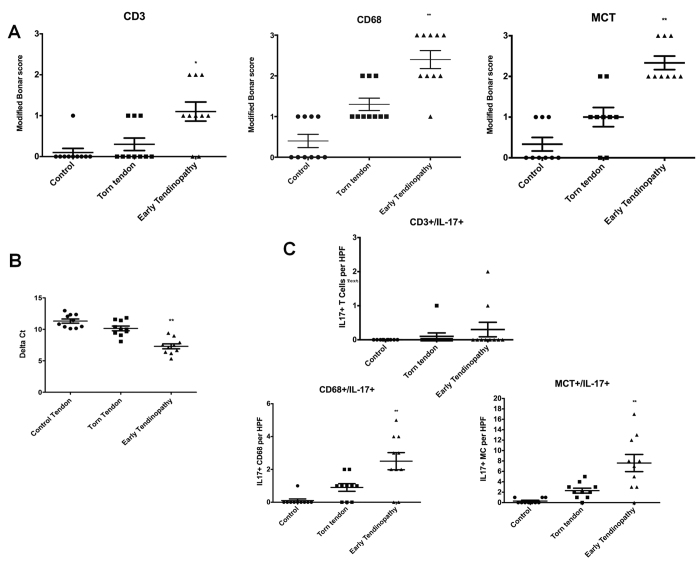
Figure 1. IL-17A expression in human tendinopathy samples.
(A) Graphs illustrate modified Bonar scoring for samples of human tendon biopsies for expression of CD3, CD68 and MCT markers with mean and SEM shown. n = 10 for control tendon, n = 10 for torn tendon and early tendinopathy. Modified Bonar scoring system depicts mean score per sample based on 10 high power fields. 0 = no staining, 1 = <10%, 2 = 10–20%, 3 = >20% + ve staining of cells per high power field. *p < 0.05, **p < 0.01 (Students t-test) (B) IL-17A gene expression in tendon samples. Delta Ct values of IL-17A in control (n = 10, intact subscapularis biopsy), torn tendon (torn supraspinatus biopsy) and early tendinopathy (matched intact subscapularis biopsy) human tendon samples (n = 10). Data are mean ± SD relative to house keeping gene18S (mean of duplicate analysis). *p < 0.05, **p < 0.01 (Students t-test). (C) Quantitative expression of CD3 + /IL-17+, CD68 + /IL17+ and MCT/IL-17+ depicts mean cells per sample based on 10 high power fields. n = 10 for control tendon, n = 10 for torn tendon and early tendinopathy *p < 0.05, **p < 0.01 versus control tissue, (Students t-test).

