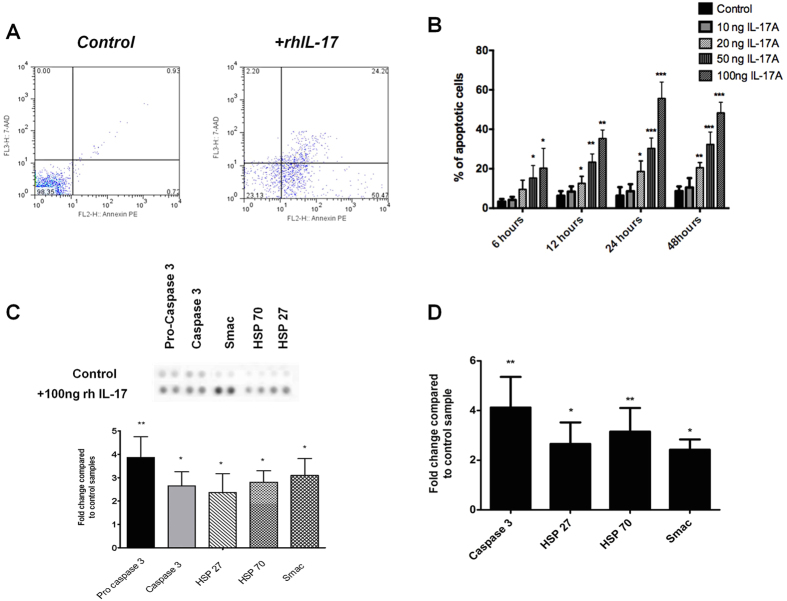
Figure 4. Apoptosis and IL-17A.
Apoptosis was evaluated after 24 h of (A) control conditions (no cytokines) and rhIL-17A stimulation (100 ng). Flow cytometry profile represents Annexin V-FITC staining in x axis and 7-AAD in y axis. (B) Time course showing percentage of apoptotic cells over a 48 hour time course under control (no cytokines) and 10 ng/20 ng/50 ng/100 ng rh IL-17A conditions. Data shown as the mean ± SD of triplicate samples and are in turn, representative of experiments performed on three normal hamstring tendon patient explants. *p < 0.05, **p < 0.01 compared to control samples (ANOVA). (C) Whole cell lysates from control and rhIL-17 (100 ng) conditions (24 hours incubation) were harvested and apoptotic markers evaluated using an apoptotic proteome profiler. The fold change of apoptotic proteins was determined by densitometry and normalised to the control sample on the array at 24 hours. *p < 0.05, **p < 0.01 compared to control samples (Students t-test). (D) The levels of mRNA for the highlighted apoptotic markers were determined by real time PCR under the same conditions (100 ng rh IL-17A at 24 hours). Data are shown as the mean fold change ± SD of duplicate samples and are representative of experiments using five individual donors of normal hamstring tendon explant tissue *p < 0.05, **p < 0.01 compared to control samples (Students t-test).

