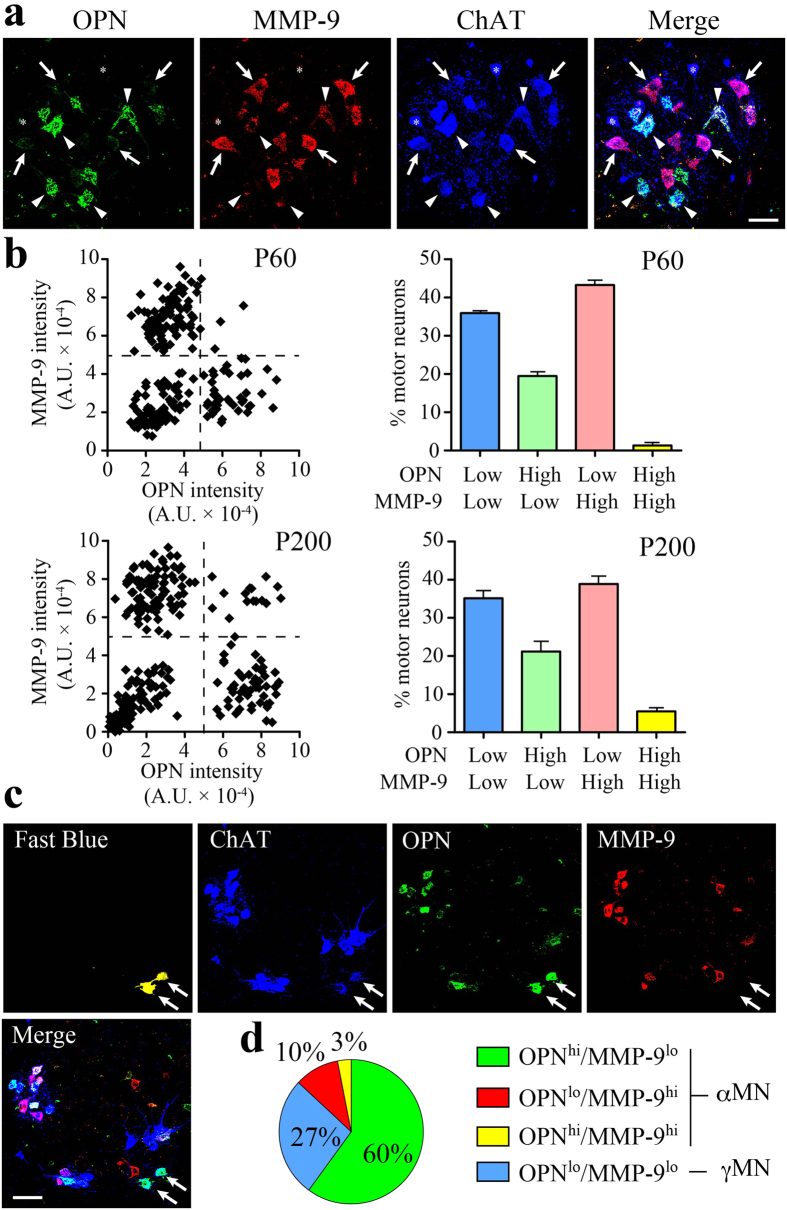
Figure 1. Contrasting localization of OPN and MMP-9 in mouse spinal motor neurons.
(a) Immunostaining of OPN (green) is segregated from that of MMP-9 (red) in ChAT (blue)-positive MNs in the mouse lumbar spinal cord on P200. Arrows, OPNlo/MMP-9hi MNs; arrowheads, OPNhi/MMP-9lo MNs; asterisks, OPNlo/MMP-9lo MNs. (b) Scatter and bar diagrams of OPN and MMP-9 fluorescence intensity in each MN (see Experimental Procedure). The scatter diagrams are representative data from P60 (n = 231 MNs) or P200 (n = 189 MNs) mouse. The bar diagrams show the percentage of MNs present in each quadrant (n = 3, with 363-595 MNs/10–12 histological sections analyzed per experimental animal). (c) Retrograde labeling of ALS-resistant MNs (arrows, false-colored yellow) in the lower lumbar spinal cord (L6) after fast blue injection into the external anal sphincter muscle. Immunostaining for ChAT (blue), OPN (green) and MMP-9 (red). (d) Fast blue-labeled MN fractions in the four groups defined by their OPN/MMP-9 expression profiles (with 51 MNs analyzed collectively from 6 experimental animals). Scale bar, 50 μm (a) and 100 μm (c). See also Supplemental Fig. 1.

