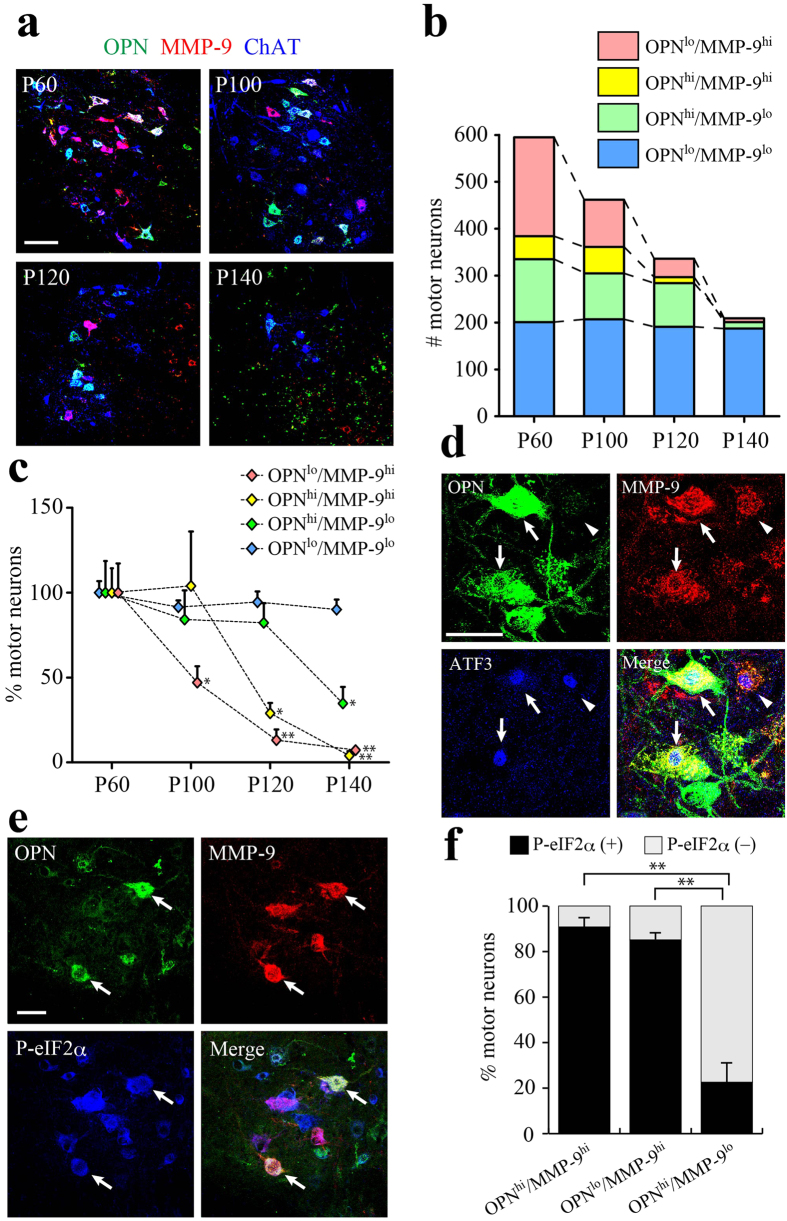
Figure 2. Remodeled FR/S motor neurons express MMP-9 and become vulnerable to mutant SOD1 toxicity.
(a) Immunostaining for OPN (green), MMP-9 (red) and ChAT (blue) in the lumbar spinal cord of SOD1G93A mice at the indicated disease stages (P60, P100, P120 and P140). (b) Changes in the numbers of MNs classified based on their OPN/MMP-9 expression profile at each stage (12 sections/mice, see Experimental Procedures). (c) Quantitative analysis of the number of MNs classified based on their OPN/MMP-9 expression profile. The each number of MNs detected at P60 were set to 100% (n = 3–4; *p < 0.05, **p < 0.01, compared with P60 values in each group, one-way ANOVA with Tukey-Kramer post hoc tests). (d) Immunostaining for OPN (green), MMP-9 (red) and ATF3 (blue) in the lumbar spinal cord of SOD1G93A mice on P60. Arrows indicate OPN/MMP-9/ATF3 triple positive cells; arrowheads indicate MMP-9/ATF3 double positive cells. (e) Immunostaining for OPN (green), MMP-9 (red) and P-eIF2α (blue) in the lumbar spinal cord of SOD1G93A mice on P60. Arrows indicate OPN/MMP-9/P-eIF2α triple positive cells. (f) P-eIF2α-positive cell fractions among the indicated MN types classified based on their OPN/MMP-9 expression profile in the lumbar spinal cord of SOD1G93A mice on P60 (n = 3; **p < 0.01, one-way ANOVA with Tukey-Kramer post hoc tests). Scale bar, 100 μm (a) and 50 μm (d, e). See also Supplemental Fig. 2.

