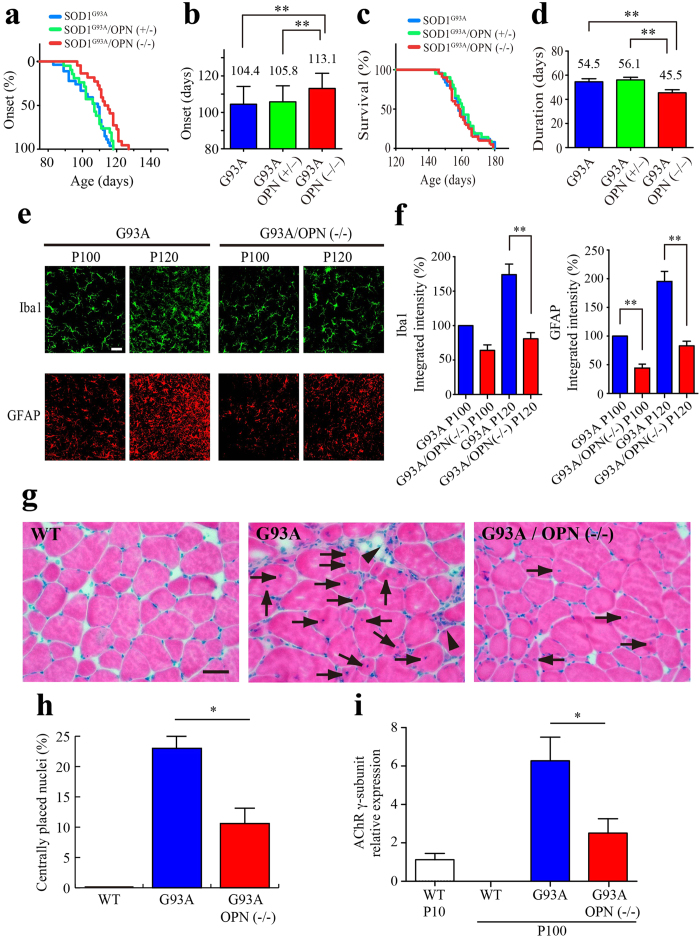
Figure 5. Genetic ablation of OPN delays disease onset but accelerates disease progression in SOD1G93A mice.
(a, c) Ages at disease onset (a) and disease end stage (c) among SODG93A/OPN−/− (red, n = 22), SOD1G93A/OPN+/− (green, n = 21) and SOD1G93A littermates (blue, n = 27). (b) Mean onset time (days ± SEM) in SODG93A/OPN−/− mice was significantly delayed (**p < 0.01, two-tailed Student’s test) as compared to SOD1G93A/OPN+/− or SOD1G93A mice (also statistically significant (p < 0.01) by Log-rank test). (d) Disease duration (from onset to end stage) was significantly shorter in SODG93A/OPN−/− (**p < 0.01, two-tailed Student’s test) than SOD1G93A/OPN+/− or SOD1G93A mice. (e) Images of Iba1 staining (green, microglia) or GFAP staining (red, astrocytes) in the lumbar spinal cord of SOD1G93A and SODG93A/OPN−/− mice. (f) Relative expression of Iba1 or GFAP (5 sections per mouse, n = 3 for each genotype and age, **p < 0.01, two-tailed Student’s test) determined from integrated fluorescent intensity measurements. (g) Hematoxylin and eosin staining of gastrocnemius muscle (P100) from control (WT), SOD1G93A and SODG93A/OPN−/− mice. The arrowheads indicate muscle atrophy, and the arrows denote centrally placed nuclei. (h) Frequency of centrally placed nuclei (8–10 sections per mouse, n = 3 for each genotype, *p < 0.05, two-tailed Student’s test). (i) Relative levels of AChR γ-subunit mRNA in gastrocnemius muscle from mice with the indicated genotypes and ages (n = 3). Data were obtained using qRT-PCR and are plotted relative to the expression in neonatal WT muscle (P10). *p < 0.05, two-tailed Student’s test. Scale bar, 20 μm (e), 50 μm (g).

