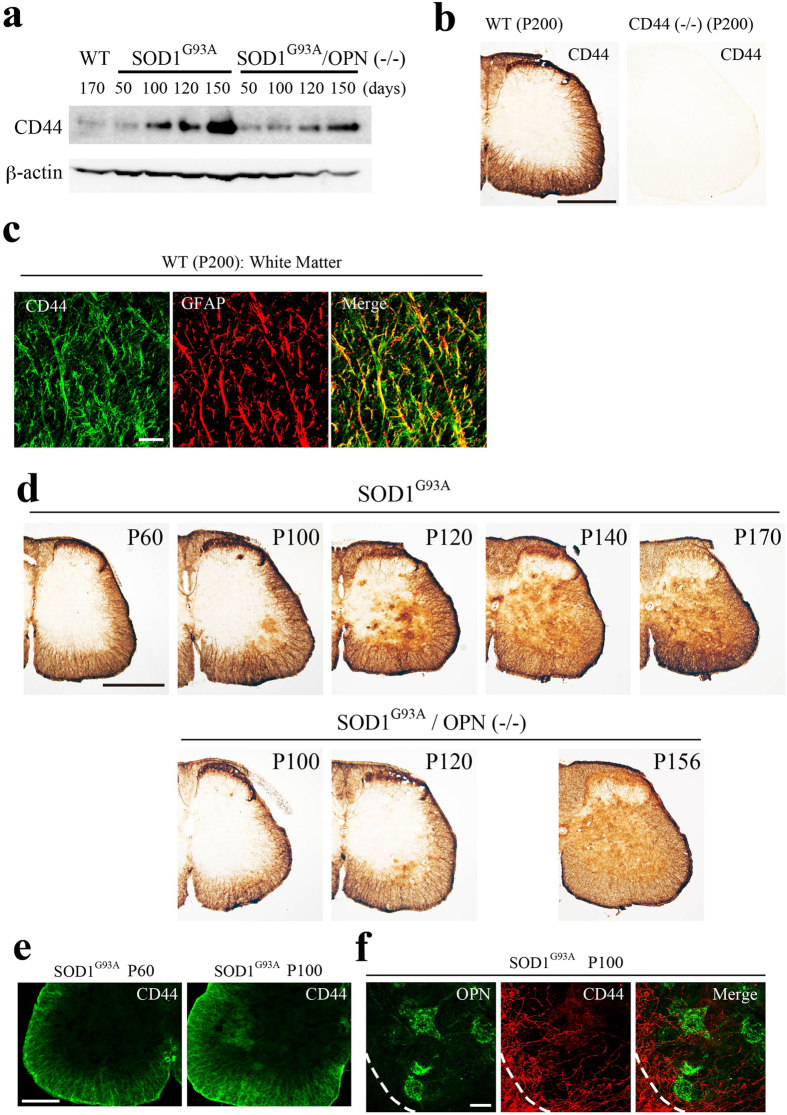
Figure 6. Changes in astrocytic CD44 expression during ALS disease progression in SOD1G93A mice.
(a) Western blot analysis of spinal cord lysates from non-transgenic control (WT), SOD1G93A and SODG93A/OPN−/− mice prepared at the indicated disease stages (days). Increased CD44 expression was observed during disease progression in SOD1G93A or SODG93A/OPN−/− mice. The full-length gel was shown in Supplementary Fig. 10b. (b) Immunostaining for CD44 (clone KM201) in WT mice revealed expression to be restricted to the white matter of the lumbar spinal cord. There was no staining in CD44−/− mice. (c) Confocal images of CD44 (green) and GFAP (red) in the ventral white matter of the lumbar spinal cords in WT mice. CD44 staining significantly overlapped fibrous GFAP-positive astrocytes in the white matter. (d) Comparison of CD44 expression between SOD1G93A and SODG93A/OPN−/− mice during the disease course. In SOD1G93A mice, from P100 onward, patchy CD44 staining appeared in the ventral gray matter around the MN pool region, and then gradually spread dorsally. The appearance and spreading of CD44 in the white matter was delayed in SODG93A/OPN−/− mice as compared with SOD1G93A mice. (e, f) Patchy spreading of CD44 staining from the white to the gray matter (e), and to the MN pool, where OPN-positive MNs are located (f) in SOD1G93A mice. Dotted lines represent the white/gray matter boundary. Scale bar, 500 μm (b, d); 20 μm (c); 200 μm (e); 50 μm (f). See also Supplemental Fig. 8.

