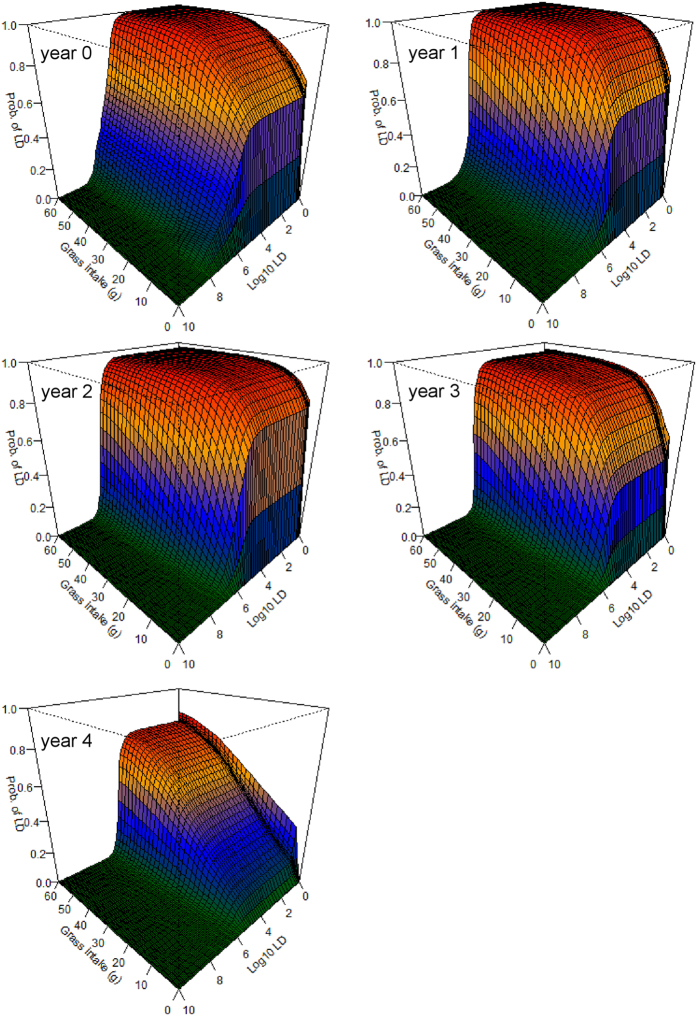
Figure 5. The probability of contacting a lethal dose (LD) of Bacillus anthracis (BA) from grazing, and ingesting soil, at anthrax carcass sites 0–4 years after host death.
The horizontal axes denote the amount of grass biomass ingested from a site (from 0–60 g) and a range of potential LDs (from 1–1010 spores) respectively, while the vertical axes show the resulting probability (from 0–1) of exceeding that LD based on the amount of grass biomass ingested. The colors are a heat map to denote relative risk within (not among) figure panels. These models assume 90% of the mass ingested is above-ground grass biomass, with 10% consisting of grass roots with an equal mass of soil attached (Equation 3). Including a component of root and soil ingestion in the models results in infection risks that are markedly higher for a considerably longer time than those seen in Fig. 4.

