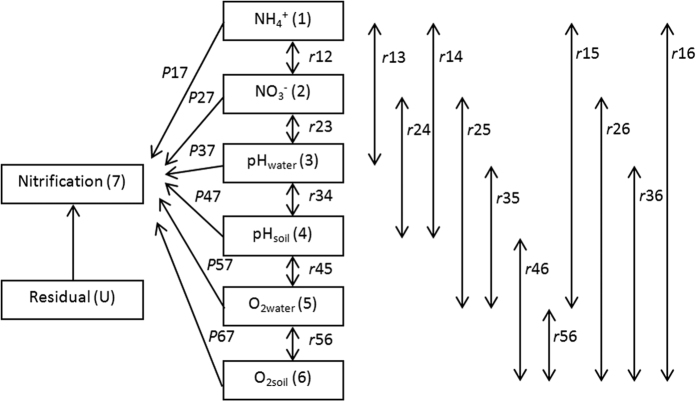
Figure 6. Path analysis diagram for the relationship between nitrification and soil properties.
Path coefficients (Pij) of soil properties are represented by single-headed arrows while simple correlation coefficients (rij) between variables are represented by double-headed arrows. Subscript designations for soil properties are identified numerically as follows: 1, NH4+ dissolved in soil (NH4+); 2, NO3− dissolved in soil (NO3−); 3, pH value measured in the water layer (pHwater); 4, pH value measured in the soil profile (pHsoil); 5, O2 concentration measured in the water layer (O2water) and 6, O2 concentration measured in the soil profile (O2soil).

